Filecoin (FIL) has broken out from a descending resistance line but failed to initiate a significant upward movement afterwards.
Holo (HOT) is trading inside a short-term descending wedge.
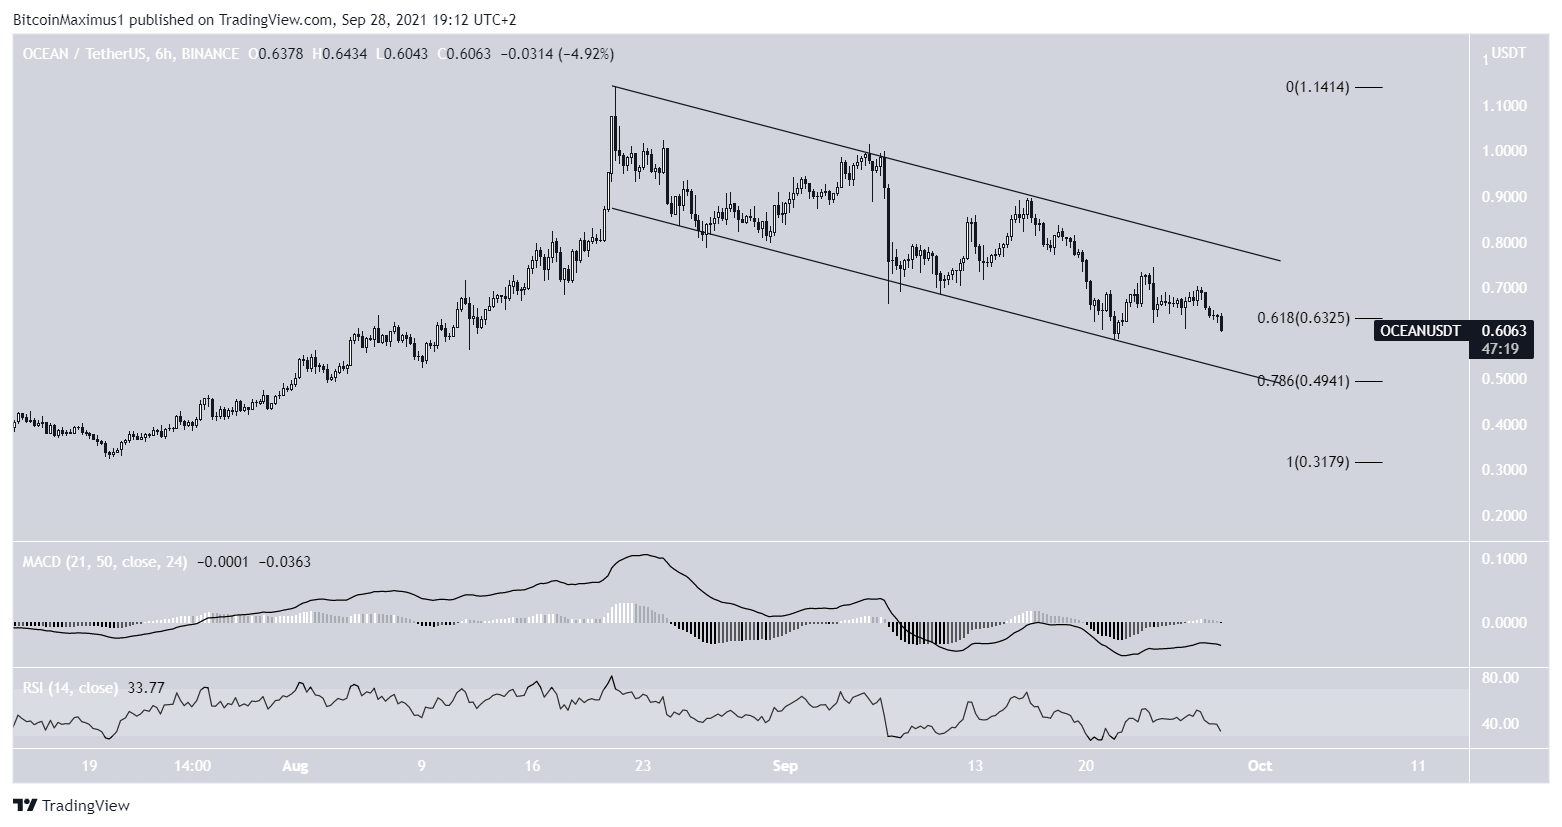
Ocean Protocol (OCEAN) is trading inside a descending parallel channel.
FIL
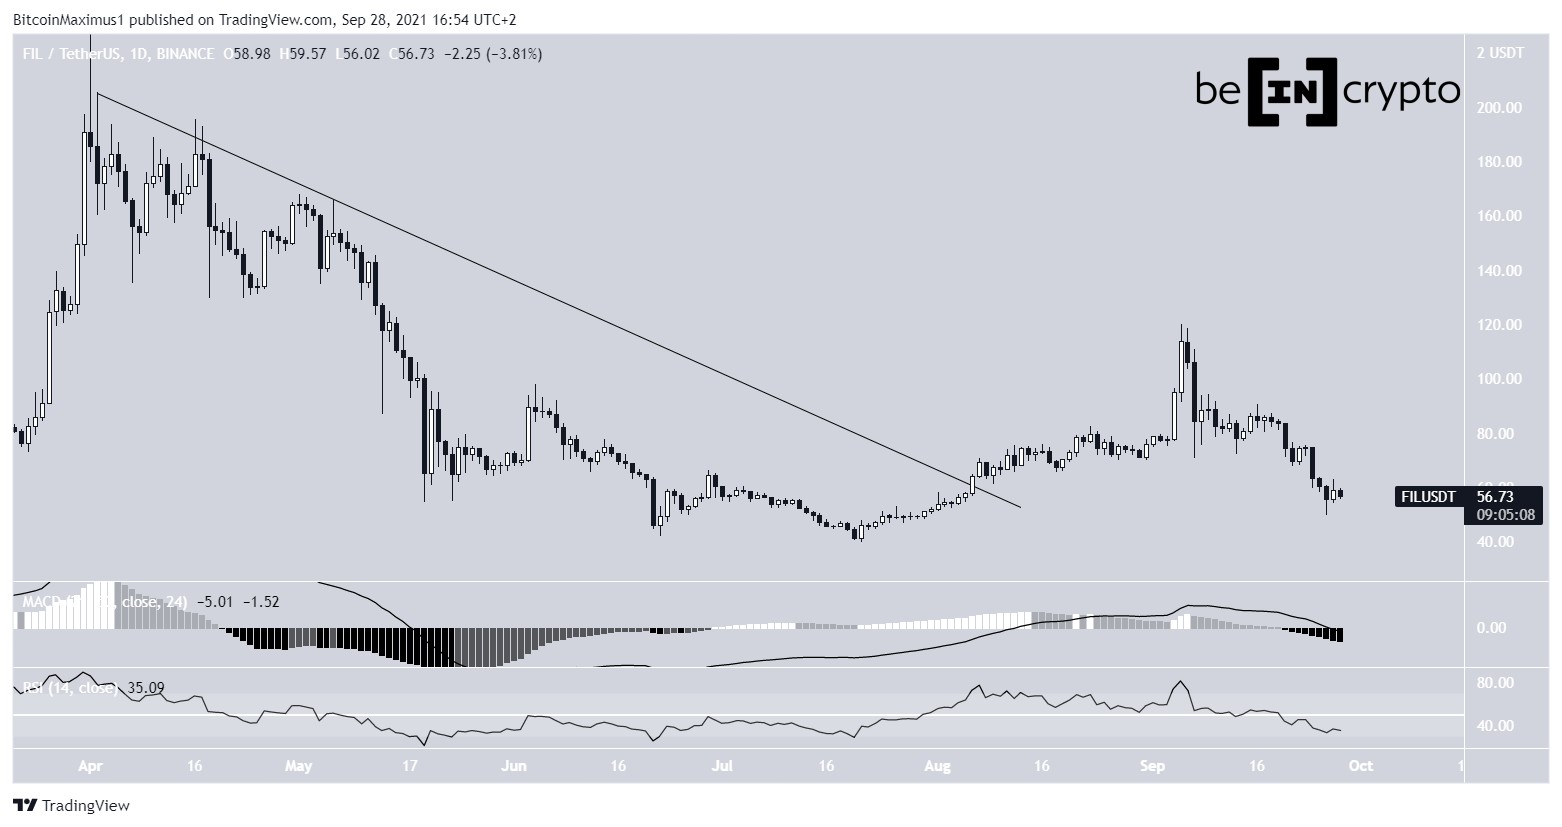
FIL has been moving upwards since July 20, when it was trading at a low of $40. On Aug 1, it managed to break out from a long-term descending resistance line and proceeded to reach a high of $120 on Sept 5.
However, it has been moving downwards since. On Sept 26, it reached a low of $50. So far, the drop has been very sharp.
Furthermore, technical indicators in the daily time-frame are bearish since both the MACD and RSI are moving downwards.
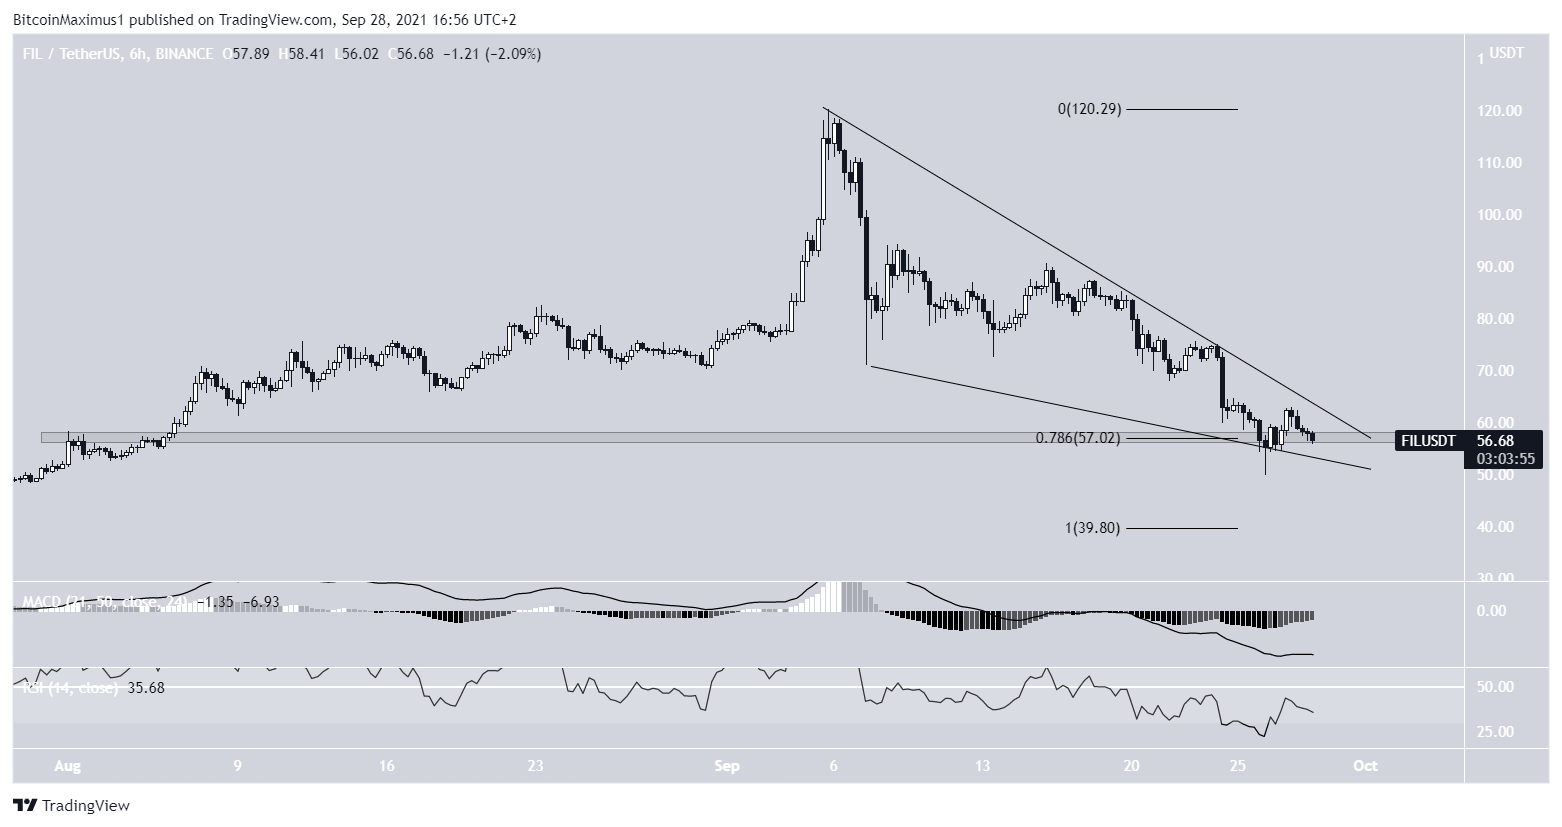
Despite the bearishness in the daily time-frame, the shorter-term six-hour chart shows that FIL is trading inside a descending wedge, which is considered a bullish pattern.
On Sept 26, it bounced at the 0.786 Fib retracement support level and the support line of the wedge. Furthermore, the MACD and RSI are moving upwards.
Therefore, the current level is very suitable for the initiation of a bounce that would cause a breakout from the wedge.
If FIL does not manage to break out, it would mean that it is heading towards the July 21 low of $40.
Highlights
- FIL broke out from a descending resistance line.
- It is trading inside a descending wedge.
HOT
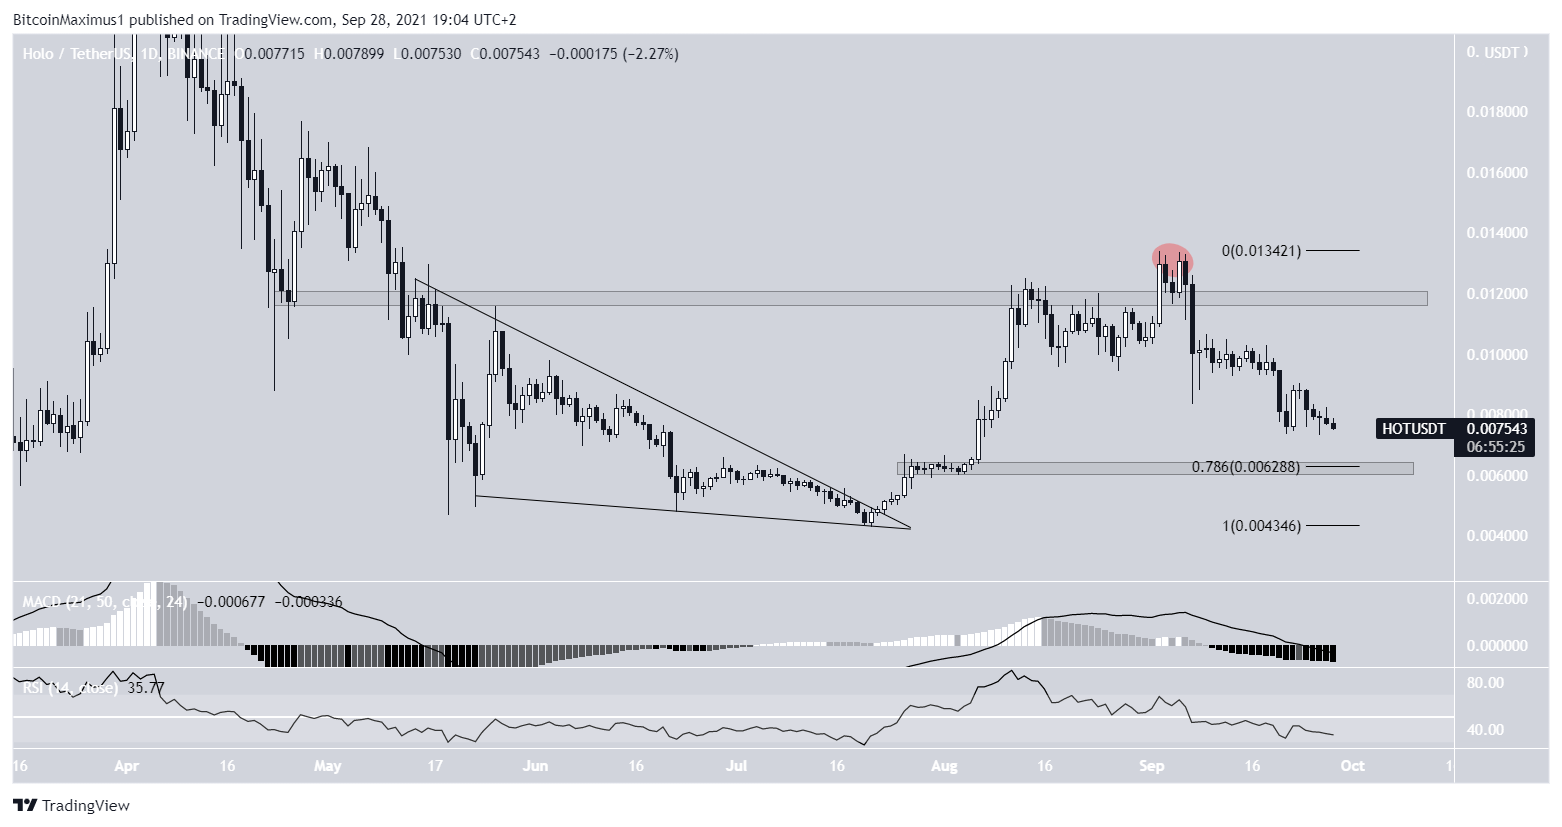
HOL has been increasing since it first broke out from a long-term descending wedge on July 22. This led to a high of $0.0134 on Sept 2.
However, while it initially seemed that the token reclaimed the $0.118 area, the breakout proved to be only a deviation (red circle), since HOT fell below the area shortly afterwards.
Currently, it is approaching the $0.063 support area. This is the 0.786 Fib retracement support level and a horizontal support area.
Technical indicators in the daily time-frame are bearish, since both the RSI and MACD are moving downwards.
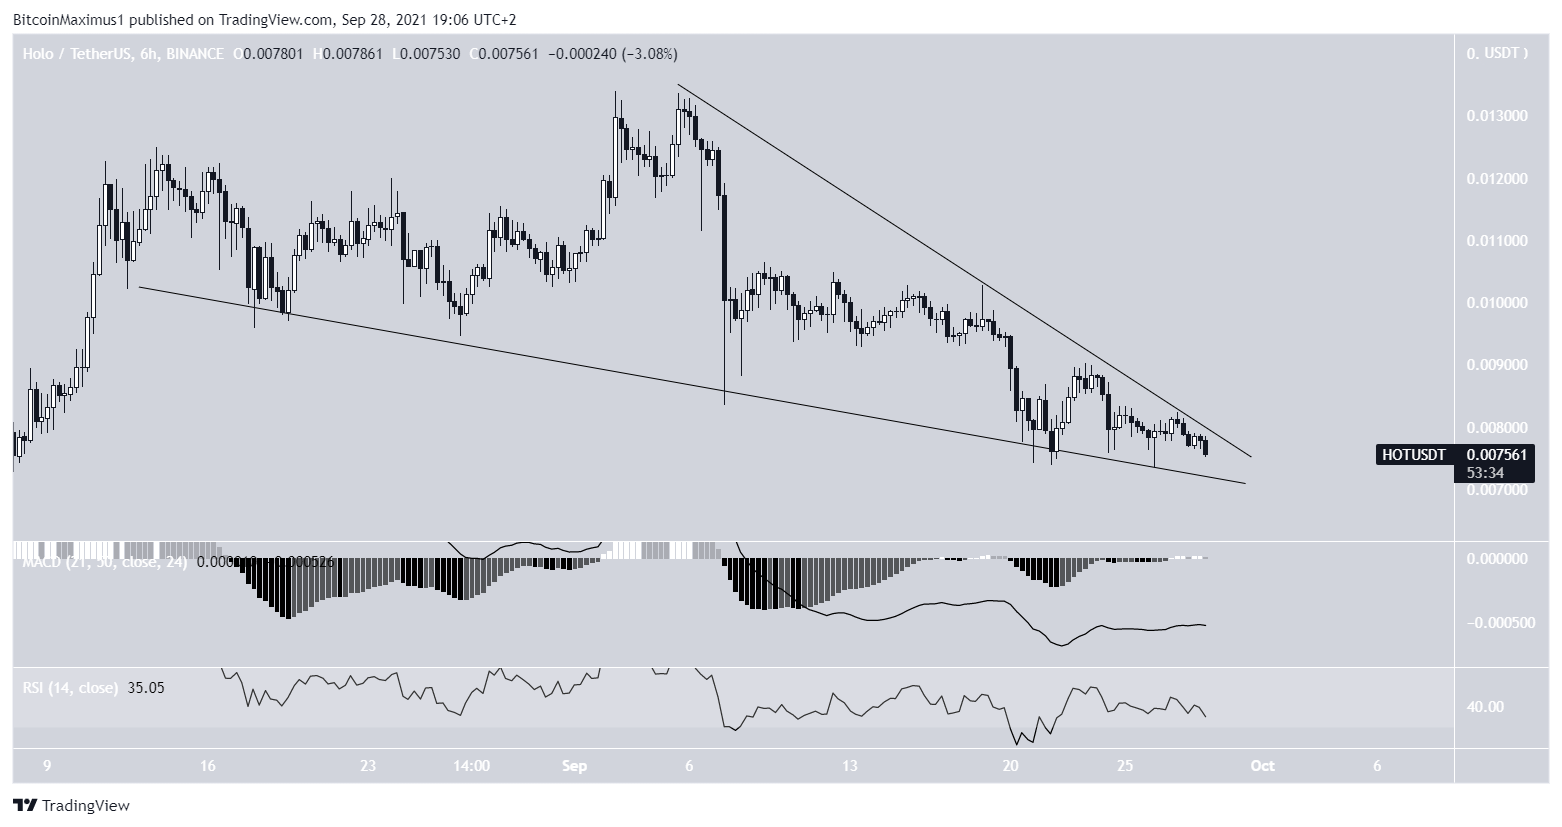
Similarly to FIL, the shorter-term six-hour chart shows that the token is trading inside a smaller descending wedge, which is considered a bullish pattern.
Currently, HOT is approaching the convergence point between resistance and support, at which time a decisive movement is expected.
Despite the bullish pattern, there are no definite bullish signs in place, neither in the daily nor the six-hour time-frames.
Highlights
- HOT is trading inside a descending wedge.
- There is support at $0.0063.
OCEAN
OCEAN has been trading inside a descending parallel channel since Aug 21. Such channel usually contain corrective structures. Therefore, in this case, a breakout would be likely.
However, the token has fallen in the lower portion of the channel and is in the process of decreasing below the 0.618 Fib retracement support level at $0.63.
The next support area is at $0.495, created by the 0.786 Fib retracement support level. It also coincides with the support line of the channel.
Since the MACD and RSI are both falling, the most likely scenario suggests that OCEAN will decrease towards this line before bouncing once more.
Highlights
- OCEAN is trading inside a descending parallel channel.
- There is support at $0.495.