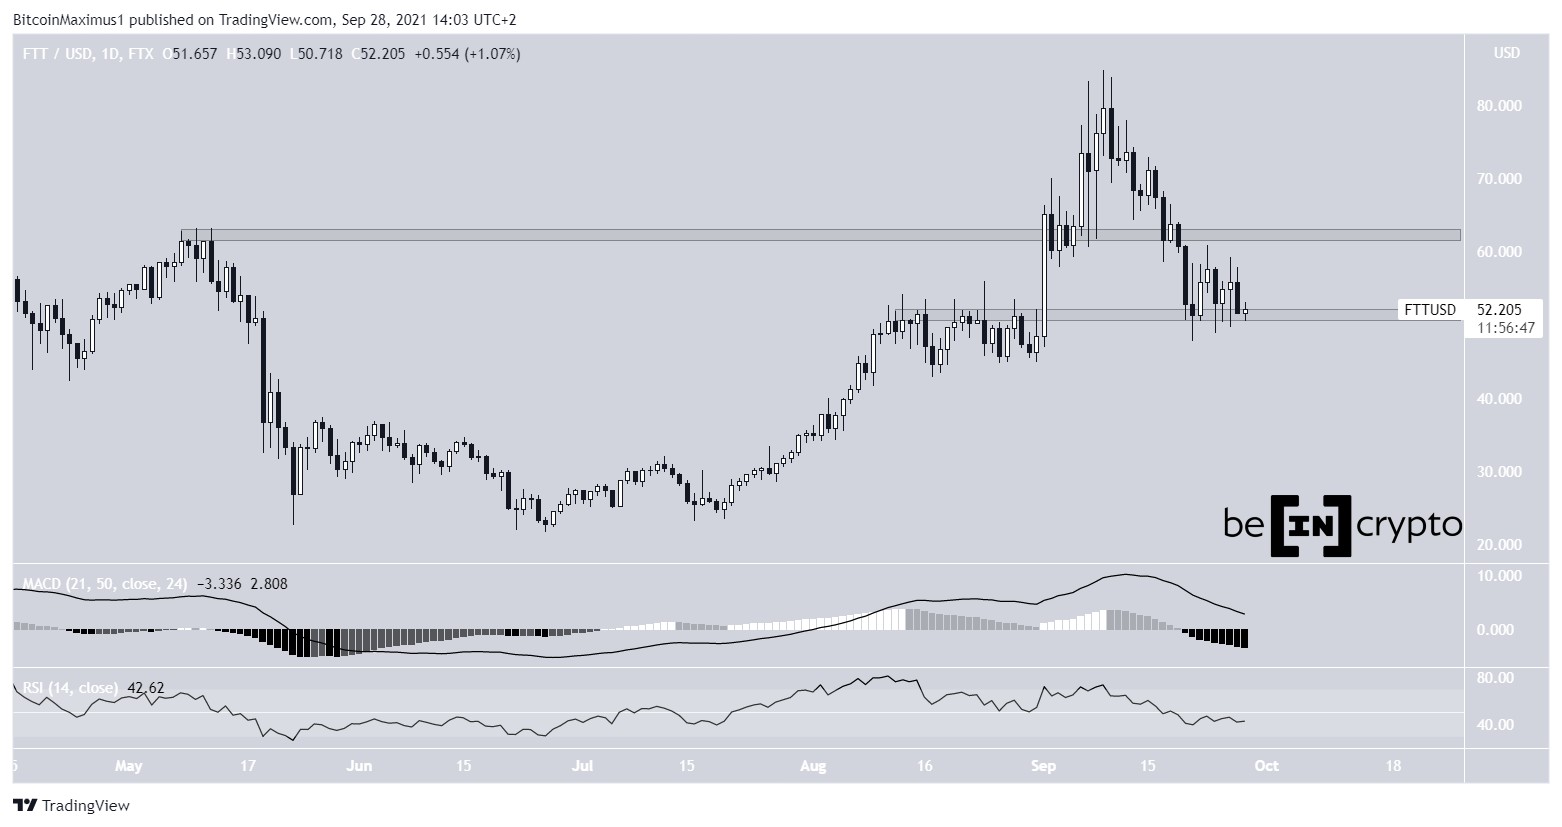
FTX Token (FTT) has been moving downwards since reaching an all-time high price on Sept 9, and recently fell below the $62.5 horizontal support area.
However, the token has created a short-term bullish pattern above $52 and could move towards the closest resistance.
FTT drops below support
FTT has been moving downward since Sept 9, when it reached an all-time high price of $84.74.
On Sept 19, it broke down below the $62.5 horizontal area, which is now likely to act as resistance.
Afterwards, FTT found support above $52, the previous resistance area that has now turned to support.
Despite the bounce, technical indicators in the daily time-frame are bearish. The MACD and RSI are both decreasing. The former is nearly negative while the latter has dropped below 50.
Short-term movement
Cryptocurrency trader @TradingTank outlined a FTX chart, stating that the token has bounced above minor support.
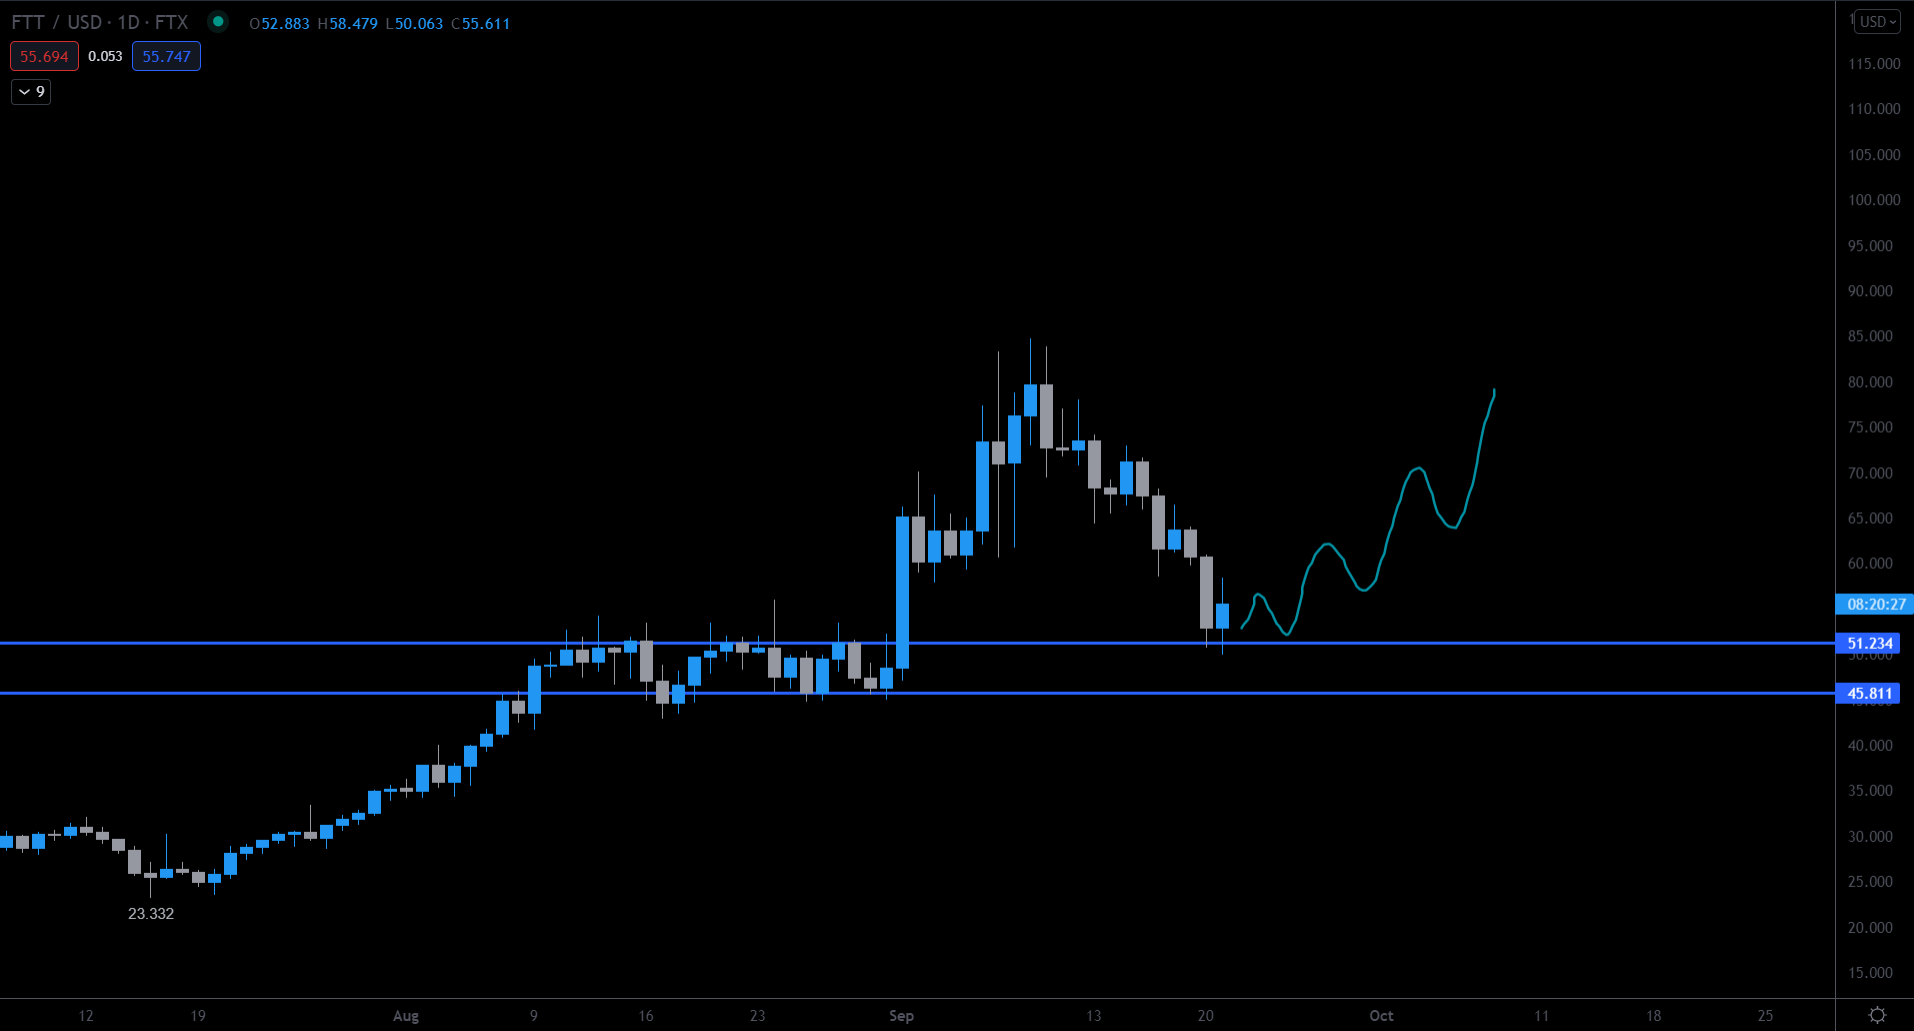
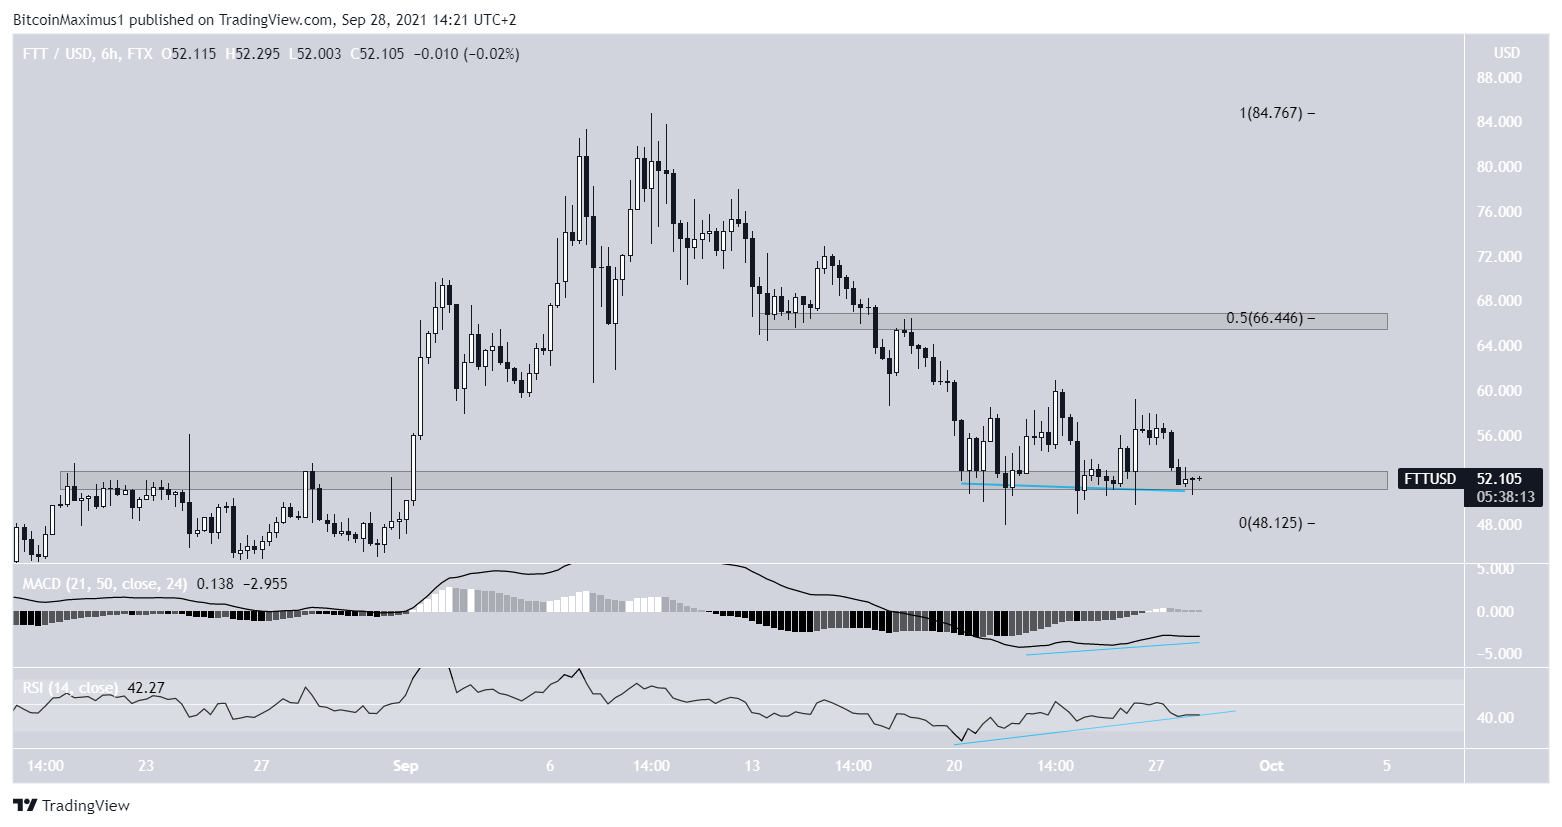
The shorter-term six-hour chart shows that FTX is holding above the $52 area and has created what looks like a triple bottom, which is considered a bullish pattern.
Furthermore, there is a bullish divergence developing in both the RSI and MACD. This is a sign that a bounce is expected.
If one occurs, the closest resistance would be at $66.5. This is the 0.5 Fib retracement resistance level and a horizontal resistance area.
Wave count
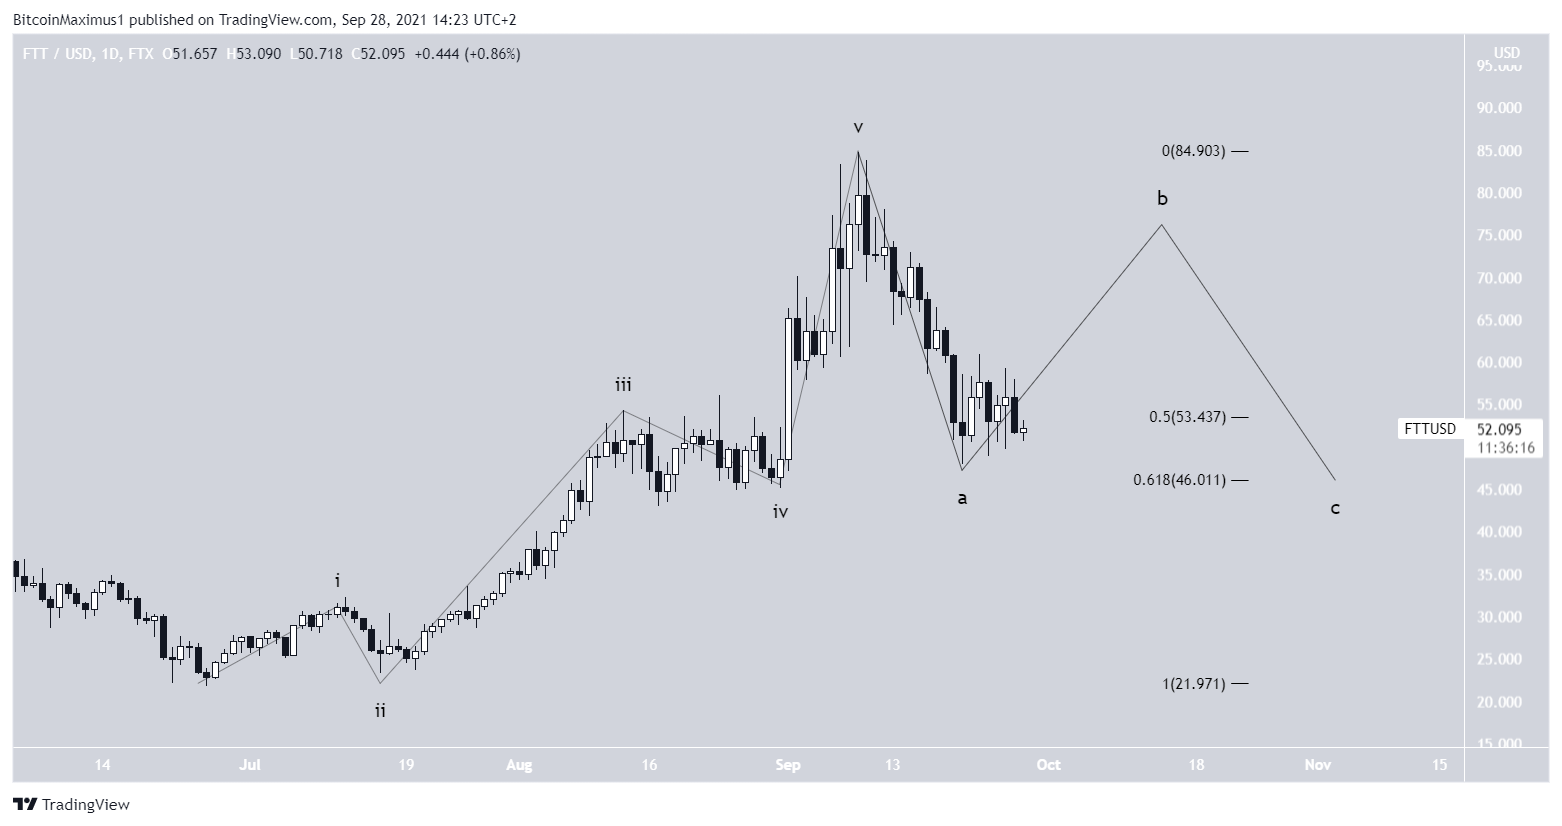
The wave count shows that FTT completed a five wave bullish impulse in the period from July 20 to the Sept 9 all-time high price.
Therefore, it is likely that the ensuing movement is part of an A-B-C corrective structure.
If so, the token is currently in the B wave, which would take it towards the $65 resistance. Afterwards, a final drop could occur.
For BeInCrypto’s latest Bitcoin (BTC) analysis, click here.
What do you think about this subject? Write to us and tell us!