In this article, BeInCrypto will take a look at on-chain indicators for Bitcoin (BTC) and Ethereum (ETH), more specifically Net Unrealized Profit/Loss (NUPL).
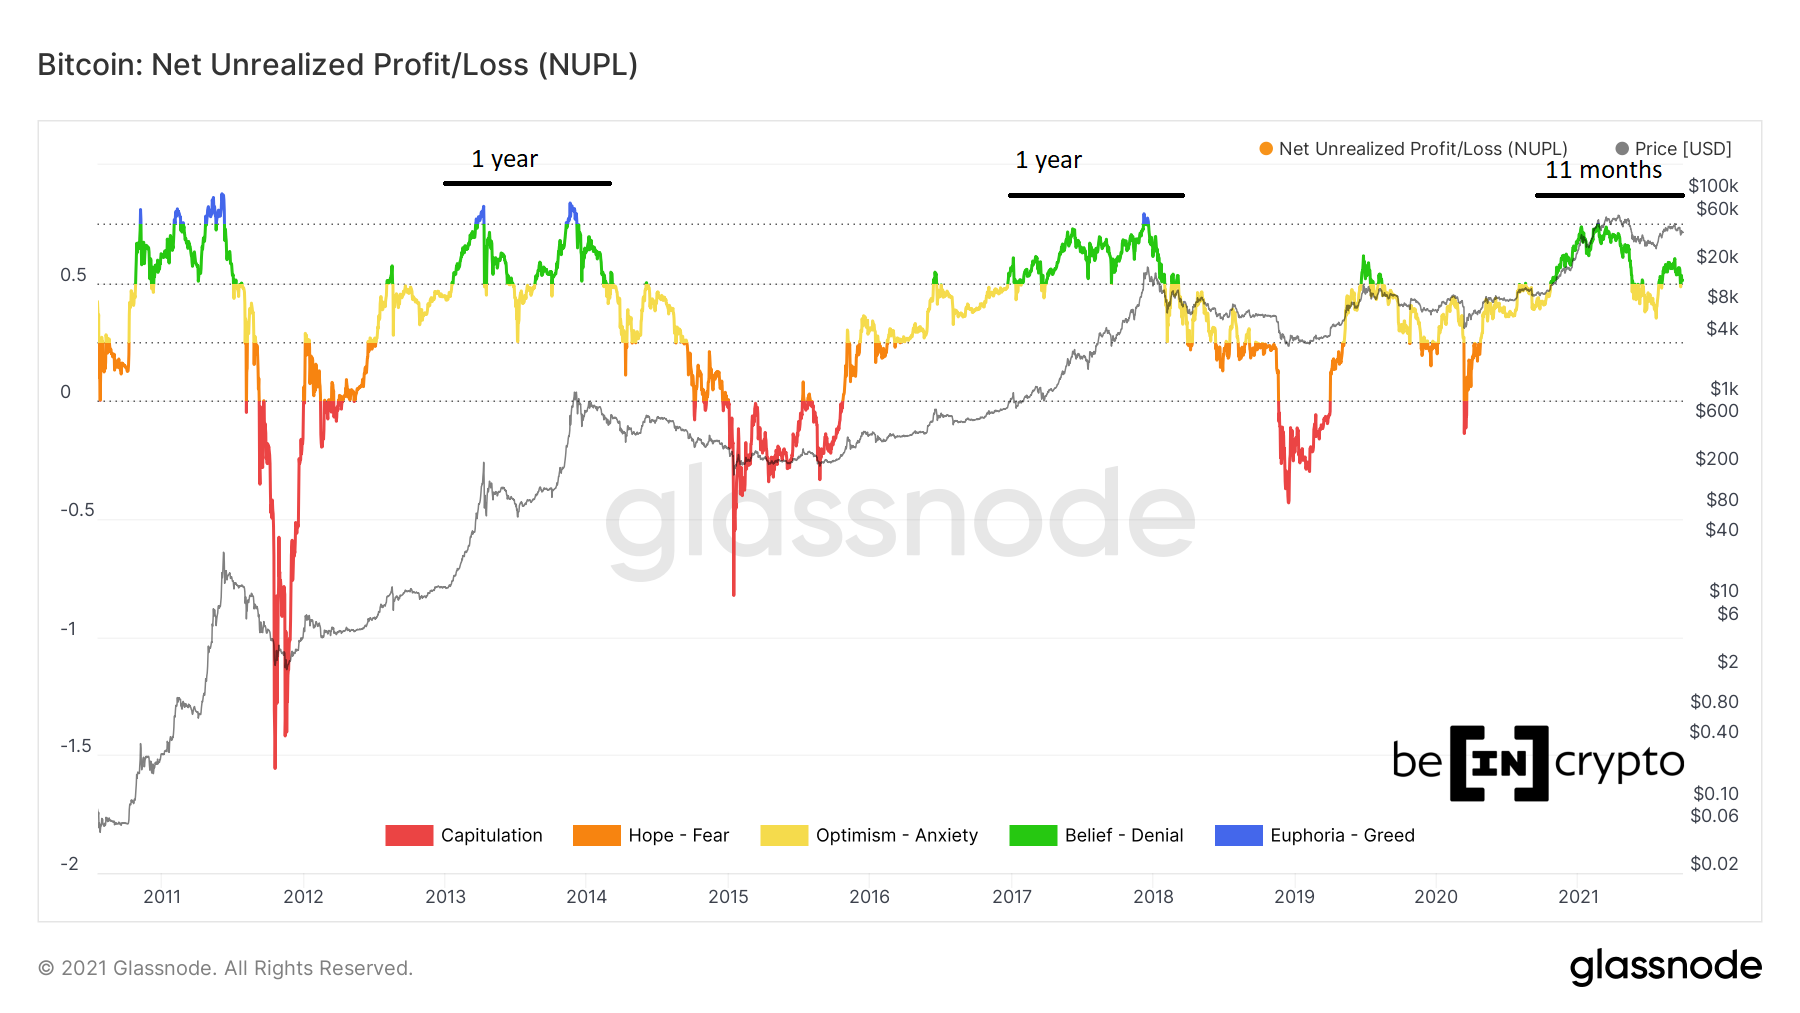
The indicator reading for BTC moved above the 0.5 benchmark 12 months ago. The previous two bull markets ended twelve months after NUPL first moved above this level.
What is NUPL?
NUPL is and indicator created by diving unrealized profits with unrealized losses. Simply put, it measures the amount of profit or loss for investors if all coins were sold today.
A negative reading indicates that investors are at a loss, while a positive one suggests that they are in profit.
When looking at historical NUPL readings for BTC, those above 0.75 (blue) have signified that a market top is relatively close.
Conversely, readings below 0.25 (red) have indicated that the bottom is close.
BTC
The yearly high NUPL reading for BTC was 0.748, reached on Feb 21. Therefore, it failed to cross the 0.75 benchmark that occurred in all previous bull markets.
The movement in 2021 is interesting since NUPL crossed below 0.5 (yellow) before moving back above and turning green.
This has similarities to the 2013 bull market, which was characterized by two tops with a sharp drop in between.
However, the length of time in which NUPL has been above 0.50 points to the bull market coming to an end. Both the 2013 and 2017 bull runs lasted roughly one year after NUPL first crossed above 0.50.
Since NUPL initially crossed above 0.50 on Oct 2020, it is approaching the one-year end point.
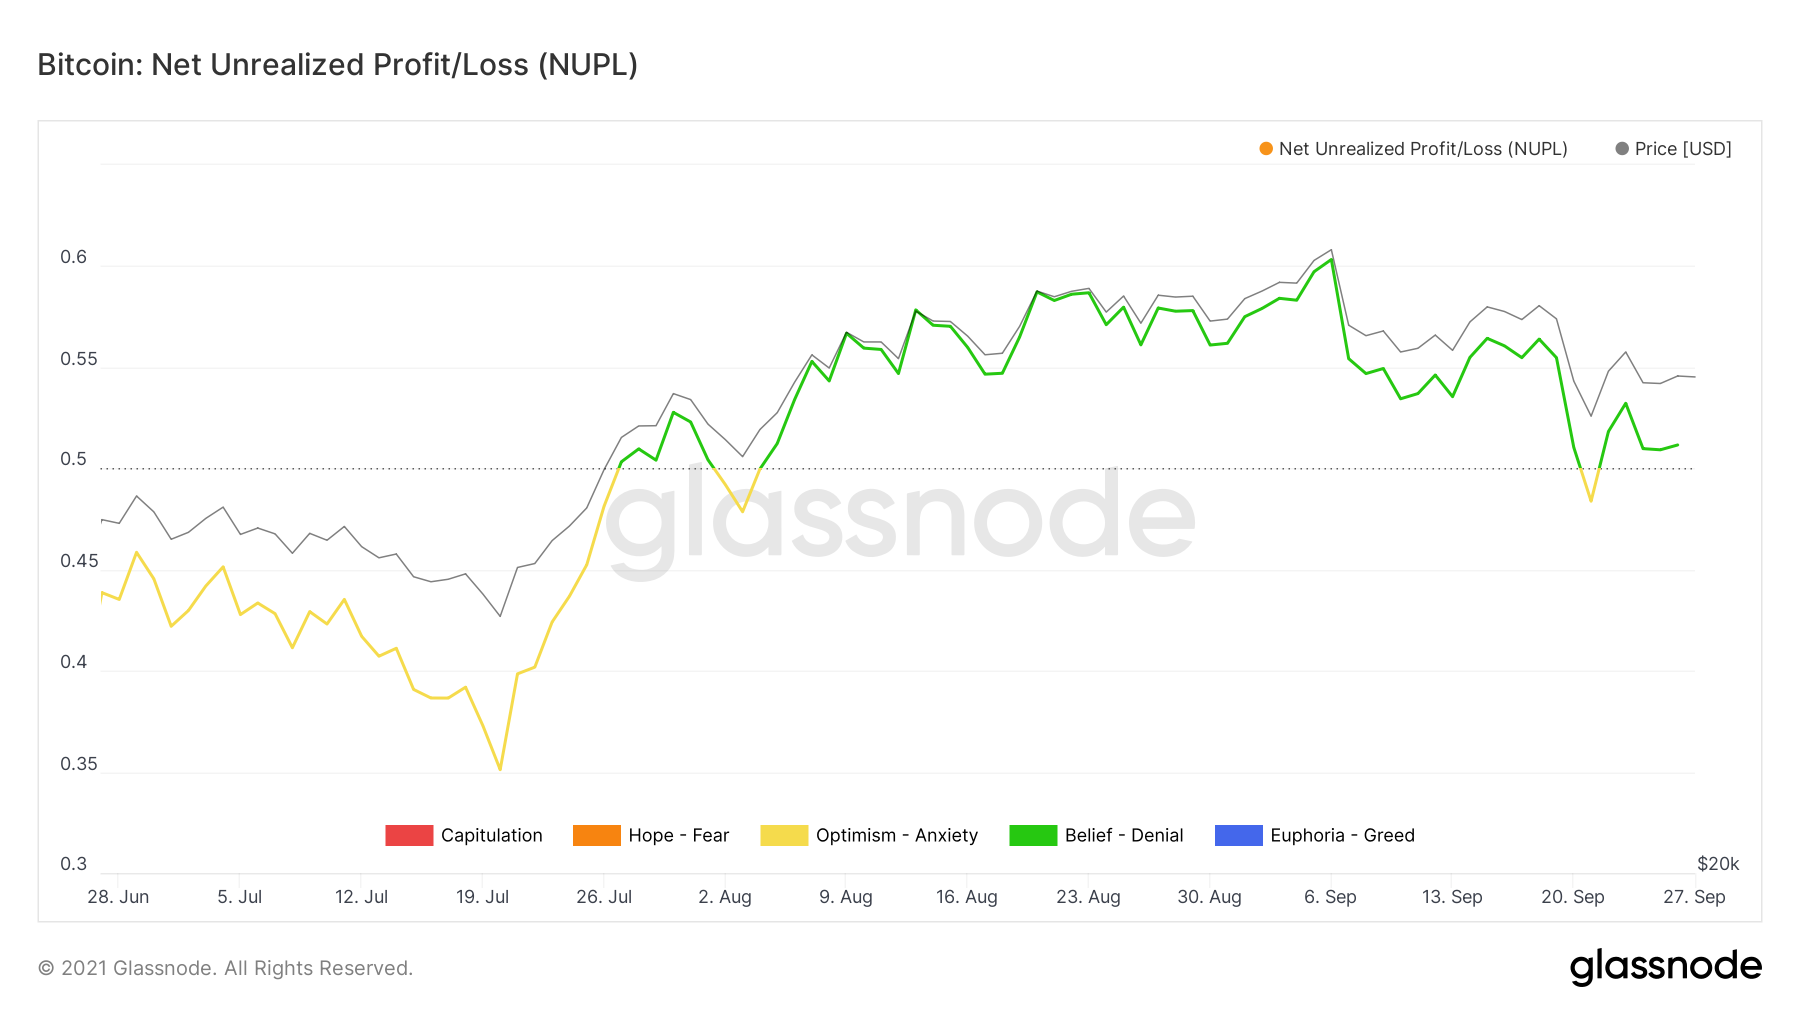
A closer look at the movement since July shows that NUPL briefly crossed below 0.5 twice before regaining the line afterwards. It is currently at 0.52.
Going by previous history, a decrease below 0.5 could spell the end of the bull market.
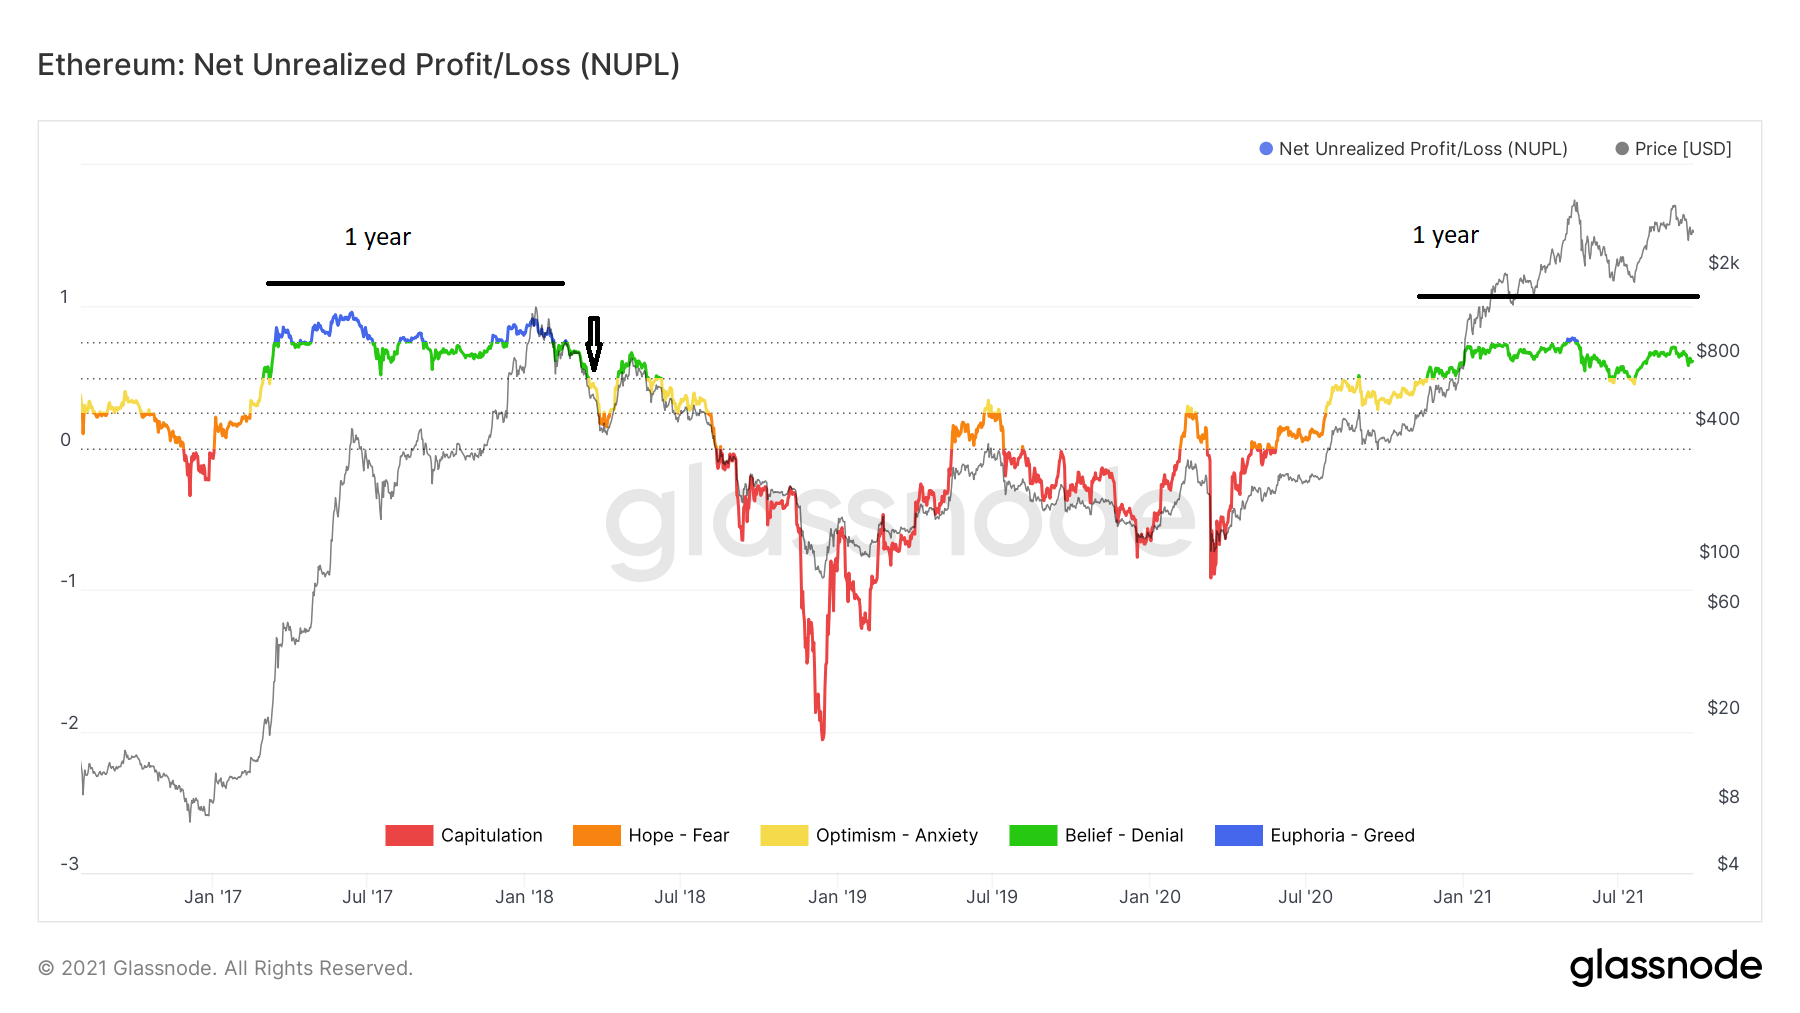
ETH
The yearly high NUPL for ETH has been 0.77, reached in January. Unlike BTC, the reading managed to cross the 0.75 line, even if it fell short of an all-time high.
Similarly to BTC, the 2017 bull run for ETH continued for roughly one year after NUPL crossed above 50. However, in the case of ETH, a NUPL cross below 50 (black arrow) marked the end of the bull run in 2017.
Currently, the bull run has gone on for slightly less than a year after NUPL first crossed above 0.5, which it did on Nov 2020.
Therefore, according to previous history, a cross below 0.50 could mean the end of the bull run.