Basic Attention Token powers blockchain-based digital advertising platforms of Brave Software. It was designed to give users a fair reward for their attention and provide advertisers with a better return on expenditure. Brave Browser provides faster-browsing speed (claims to be 2x faster than Chrome), protects privacy, and also provides Malware protection. Let us look at the technical analysis of BAT.
Past Performance of Basic Attention Token
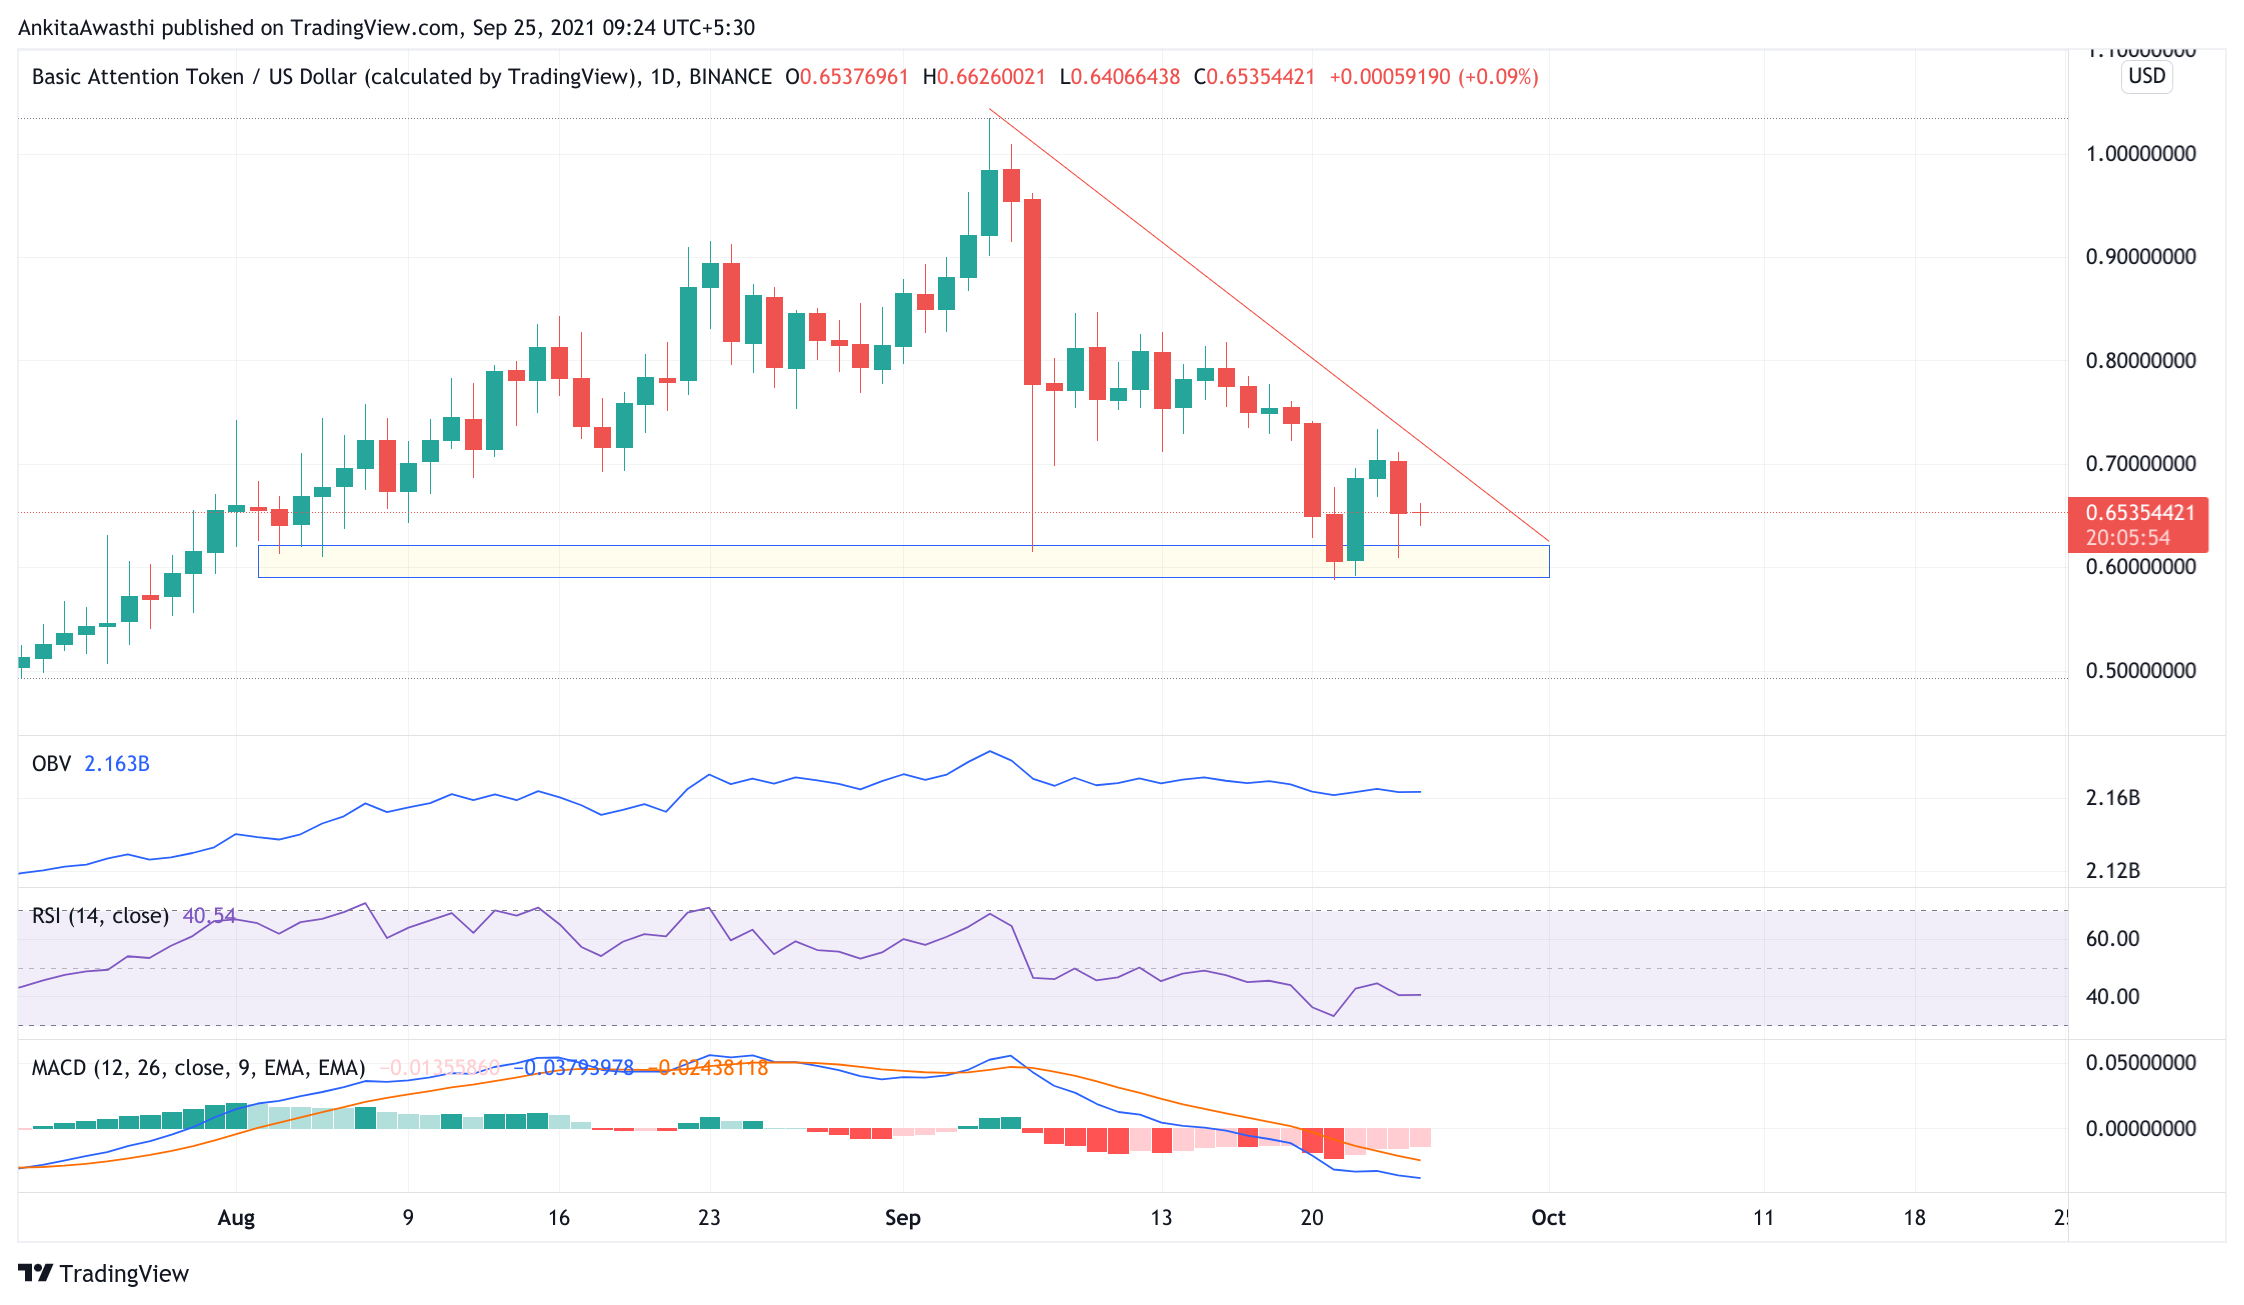
On September 18, 2021, BAT opened at $0.750. On September 24, 2021, BAT closed at $0.653. Thus, in the past week, the BAT price has decreased by approximately 11.98%. In the last 24 hours, BAT has traded between $0.626-$0.693.
https://www.tradingview.com/x/5oCYJaXW/
BAT Technical Analysis
The entire crypto market tumbled last night when China imposed a ban on trading bitcoin. However, the news is not new. The ban has been imposed N number of times. People can still possess cryptocurrencies, but can not trade them. Bitcoin corrected by almost 9-10% after this news. Now, bitcoin is back on track and is trading above $42,000. Let us see what the day looks like for this altcoin :
Currently, BAT is trading at $0.657. The price is slightly higher than the day’s opening price. The price can again try to retest the support level, the bearish trend would be confirmed if it breaks down from the demand zone.
The MACD and signal lines are negative. Moreover, a bearish crossover by the MACD line over the Signal line has occurred. Thus, the overall market momentum looks bearish for the rest of the day ahead. Hence, the price may decrease.
Currently, the RSI indicator is at 40.34%. It faced rejection at 38.39% and rose to this level. Thus, buying pressures are slowly mounting. We have to wait and watch if buying pressures become strong enough to bring about a bearish trend reversal.
On the daily chart, the OBV indicator is trending upward. Thus, buying volumes are higher than selling volumes.
In short, when we look at all three oscillators, we can say that the price may continue to fall. However, we cannot rule out the possibility of a trend reversal. We have to wait and watch if an intermittent price rise is a corrective action or the beginning of a positive trend.
Day-Ahead and Tomorrow
Currently, the BAT price is below the second Fibonacci pivot point of $0.732. If the bears remain strong till day end, then the price is likely to fall below the first, second, and third support levels of $0.62, $0.59, and $0.54, respectively.
However, on the upside, if the immediate resistance of level $0.70 is broken, it will highlight the next resistance at $0.73. That can be kept as the target for the long call.