Shiba Inu (SHIB) yesterday reached the range high where it has been trading since May 2021. If the token breaks out of that area, it could begin a parabolic rise.
SHIB currently ranks as the 47th largest cryptocurrency by market capitalization, according to Coingecko. The main “dog competitor” and also the younger brother of Dogecoin (DOGE) broke out of the descending triangle pattern and validated the falling resistance line as support.
SHIB reaches the range high
Since the May 2021 declines, SHIB has been in a range between resistance in the $0.00000950 area (red rectangle) and support at $0.00000550 (green rectangle). Over a period of almost 4 months, the altcoin has repeatedly reached and bounced off these two areas.
On 16 September, SHIB rose 26% to reach the resistance area again a day later. At the press release, this area rejected the price and left a long upper wick.
However, if the daily candle closes above $0.00000904, a higher high will be printed on the daily chart. Combined with the higher low (blue arrows) of 7 September, this could signal a reversal and the start of an upward impulse.
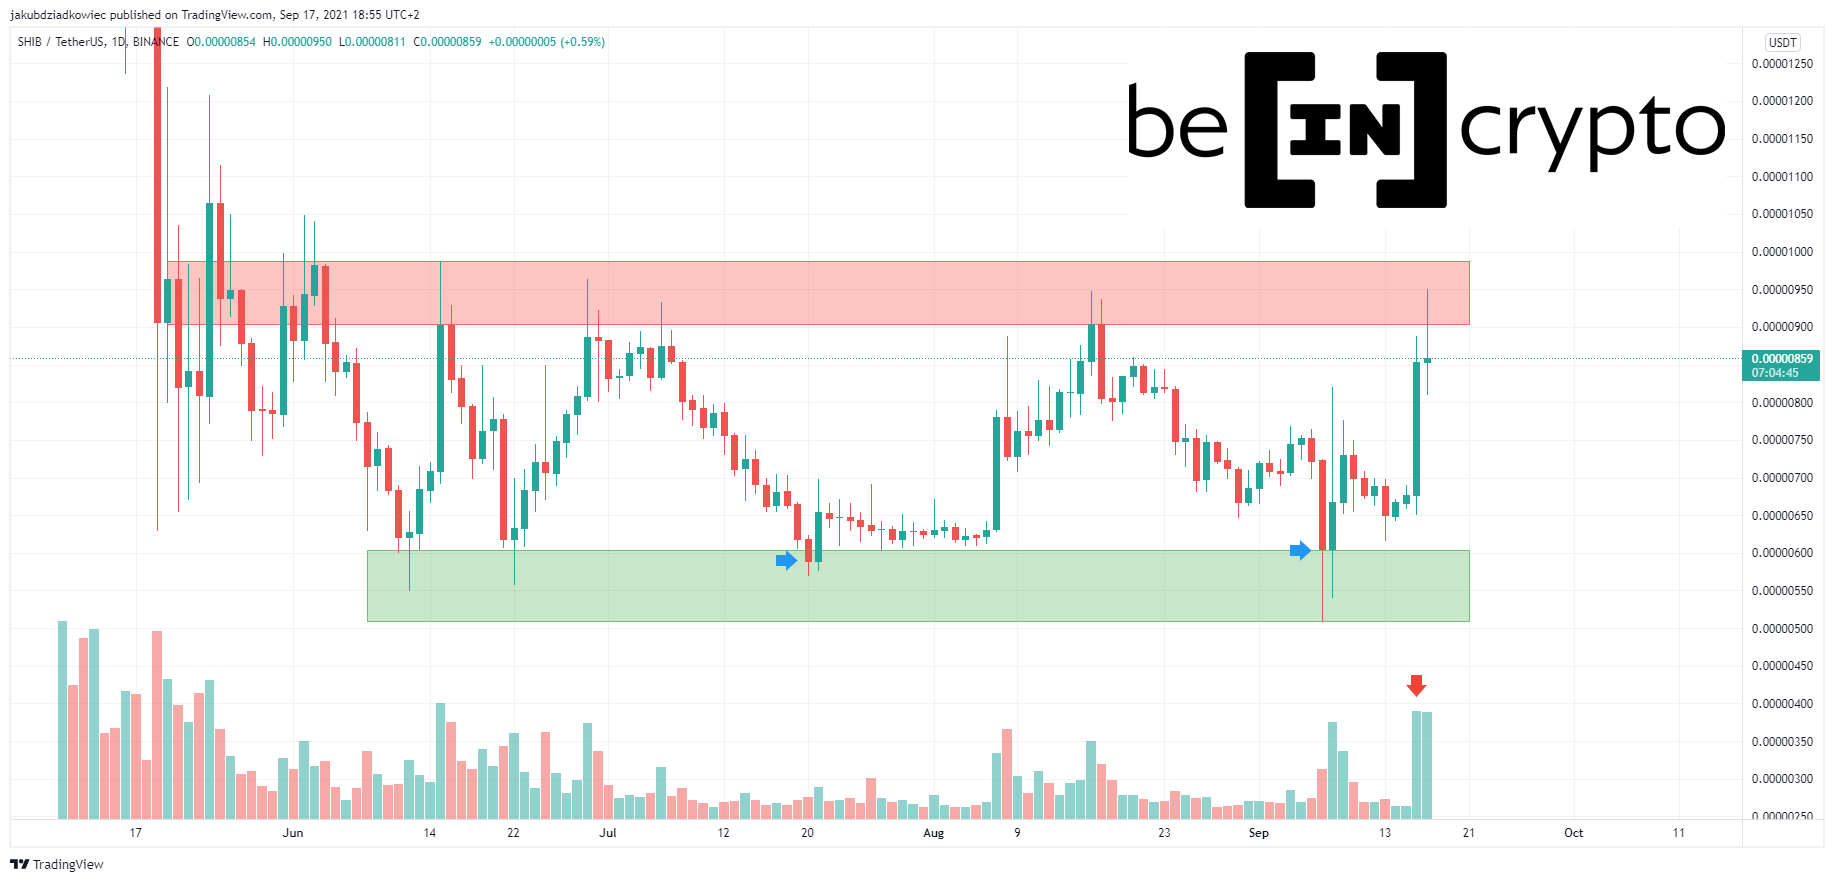
The possibility of breaking through the top of the range and continuing the uptrend is also confirmed by the growing volume signature. During the last two days, it reached the highest values since mid-June (red arrow).
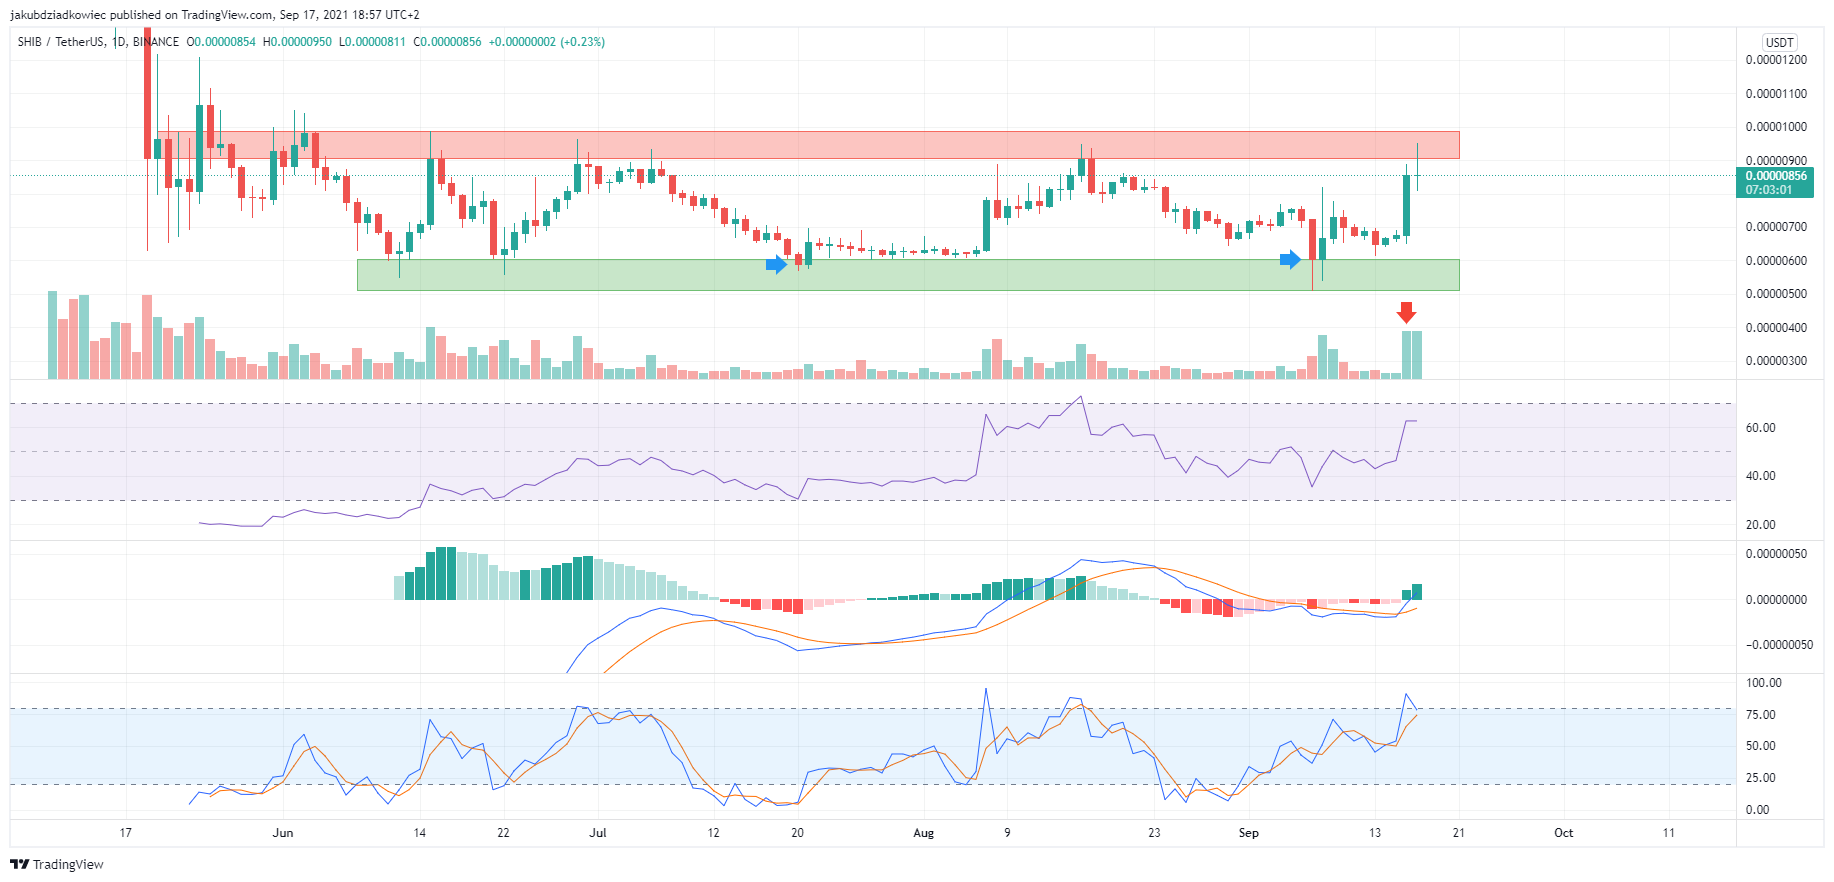
Technical indicators confirm the possibility of the continuation of the uptrend. RSI has broken above the 50 line and is rising. MACD generated two positive momentum bars and the signal line is close to entering positive territory. The stochastic oscillator is heading upwards and is close to entering bullish territory above 80.
Descending triangle
The daily chart also shows the breakout from the descending triangle that occurred on 7 September (orange arrow). On that day, SHIB rose 24% and began a multi-day consolidation. It then rose to the top of the range at $0.00000950 and started a downtrend.
The downward movement validated the descending triangle line twice as support (orange circles) and brought the price to the bottom around the range support area. Since then, SHIB has risen 40% and continues its upward movement.
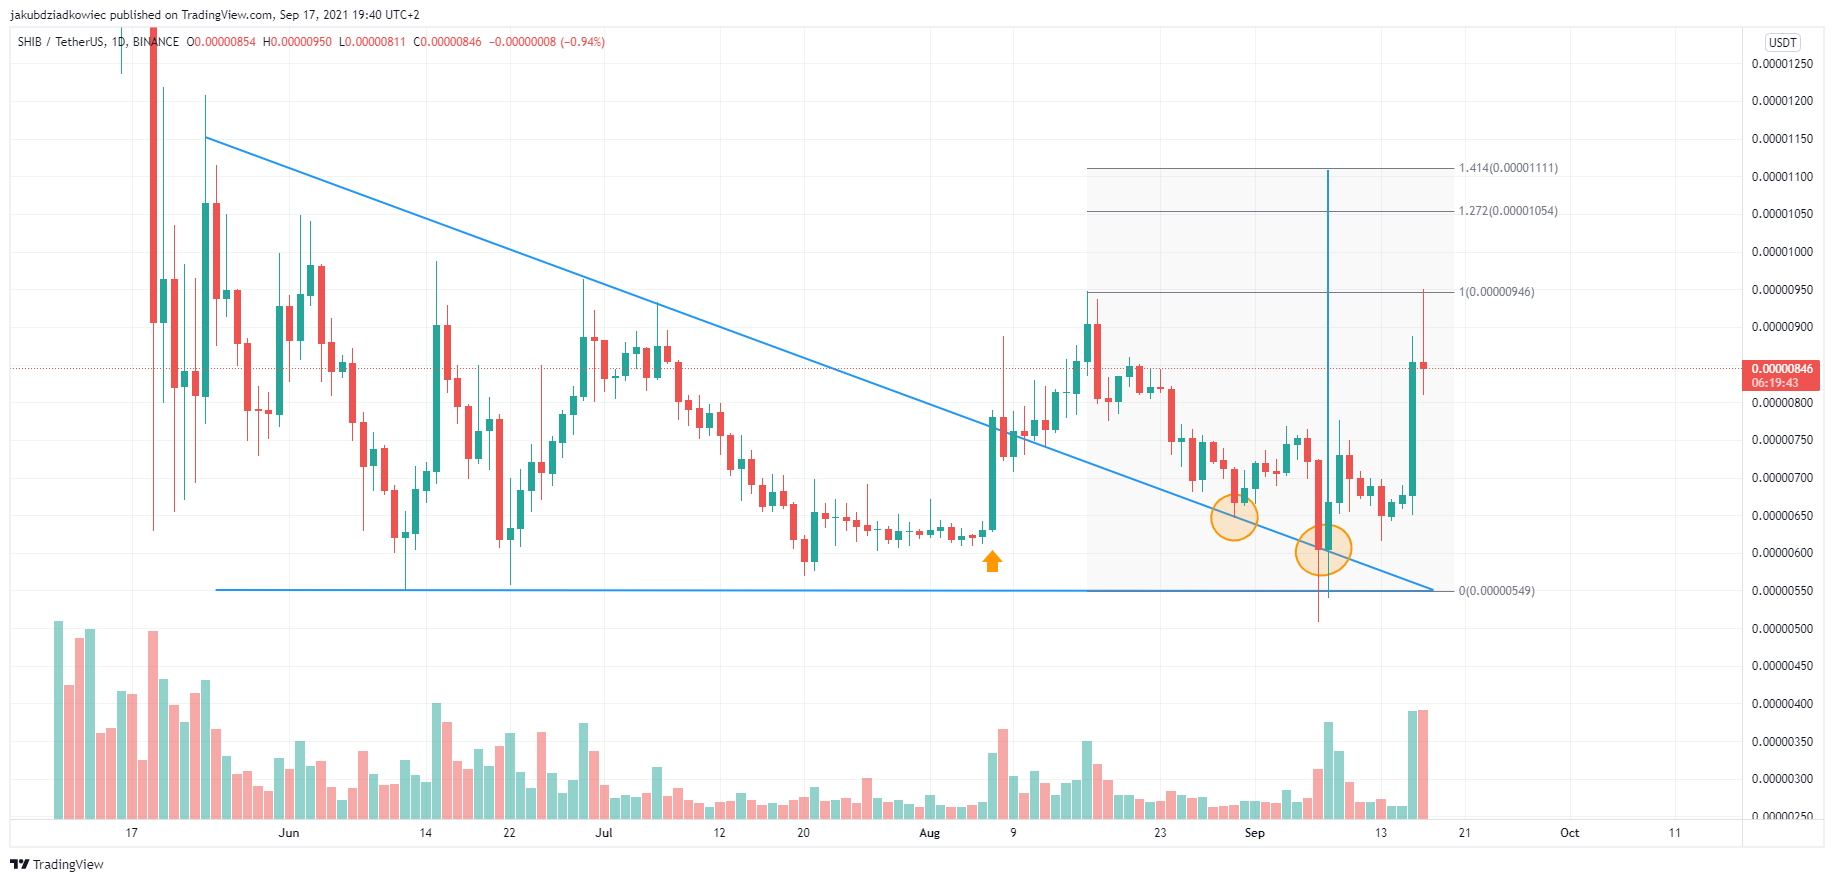
The movement target for this pattern as measured by the height of the descending triangle is the $0.00001100 level. This resistance coincides with the 1.414 Fib external retracement level measured for the last downward movement. If SHIB reaches this peak, it will confirm the breakout from the range described in the previous section.
SHIB future movement
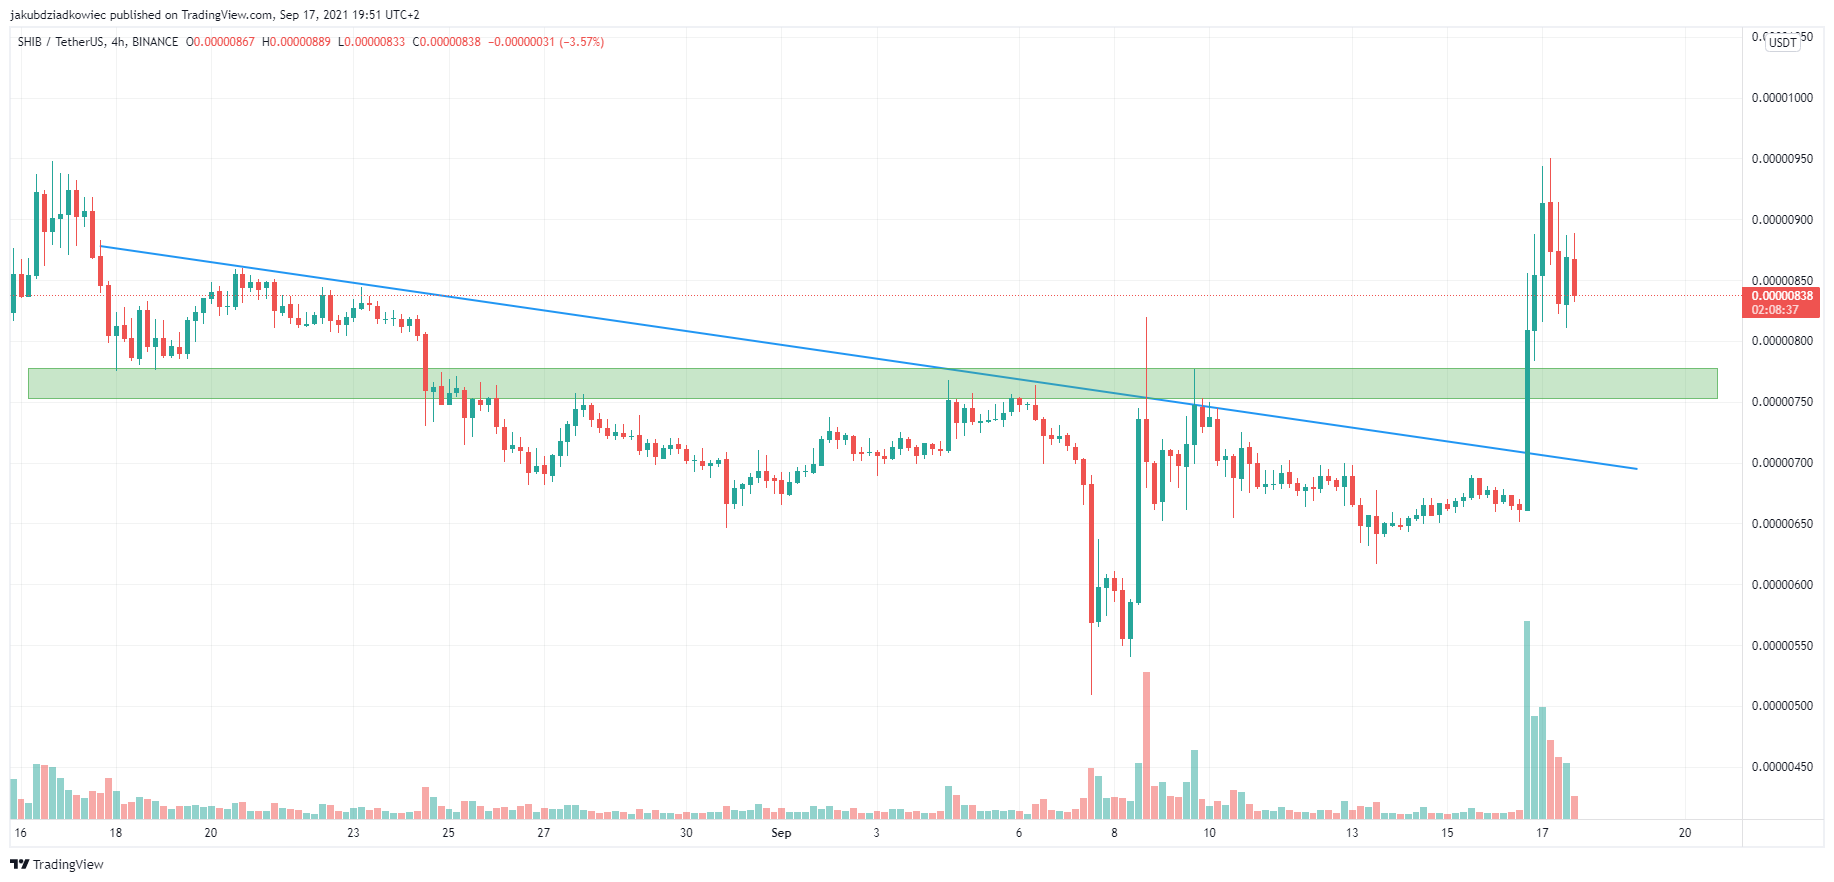
The short-term 4-hour chart shows a breakout from the descending resistance line that has been respected since August 17. The line was tested several times until it was decisively broken through with high volume on 16 September.
At the same time, the SHIB price also broke through the short-term support/resistance area near $0.00000760 (green rectangle). It coincides with the 0.382 Fib retracement level. It is expected that in the short term it will serve as support and the price will validate the area before continuing the upward movement.
For BeInCrypto’s latest Bitcoin (BTC) analysis, click here.
What do you think about this subject? Write to us and tell us!