WBNB stands for “wrapped” BNB token. BEP-20 allows any token to trade on Binance Smart Chain. It can be used for multiple transactions, such as transfers from one wallet to another and transactions on exchanges. There is no owner for BEP-20 tokens. However, ERC-20 facilitates cross-chain transfer. Let us look at the technical analysis of wBNB.
Past Performance
WBNB started trading at $418.16 on September 08, 2021. On September 14, 2021, wBNB ended the day at $414.10. Amid volatility in the market, wBNB lost 1% in the previous week. And, in the last 24 hours, wBNB traded between $399.50-$418.66.
https://www.tradingview.com/x/wW8a7BlU/
WBNB Price Analysis
The basic difference between BNB and wBNB is that BNB is not associated with BEP-20 standards. Therefore, you can use wBNB on Binance smart chain but not BNB. The global acceptance and extra use cases of BEP-20 tokens have increased the demand for such coins, therefore, the price has shot up. Let see what the day ahead holds for traders;
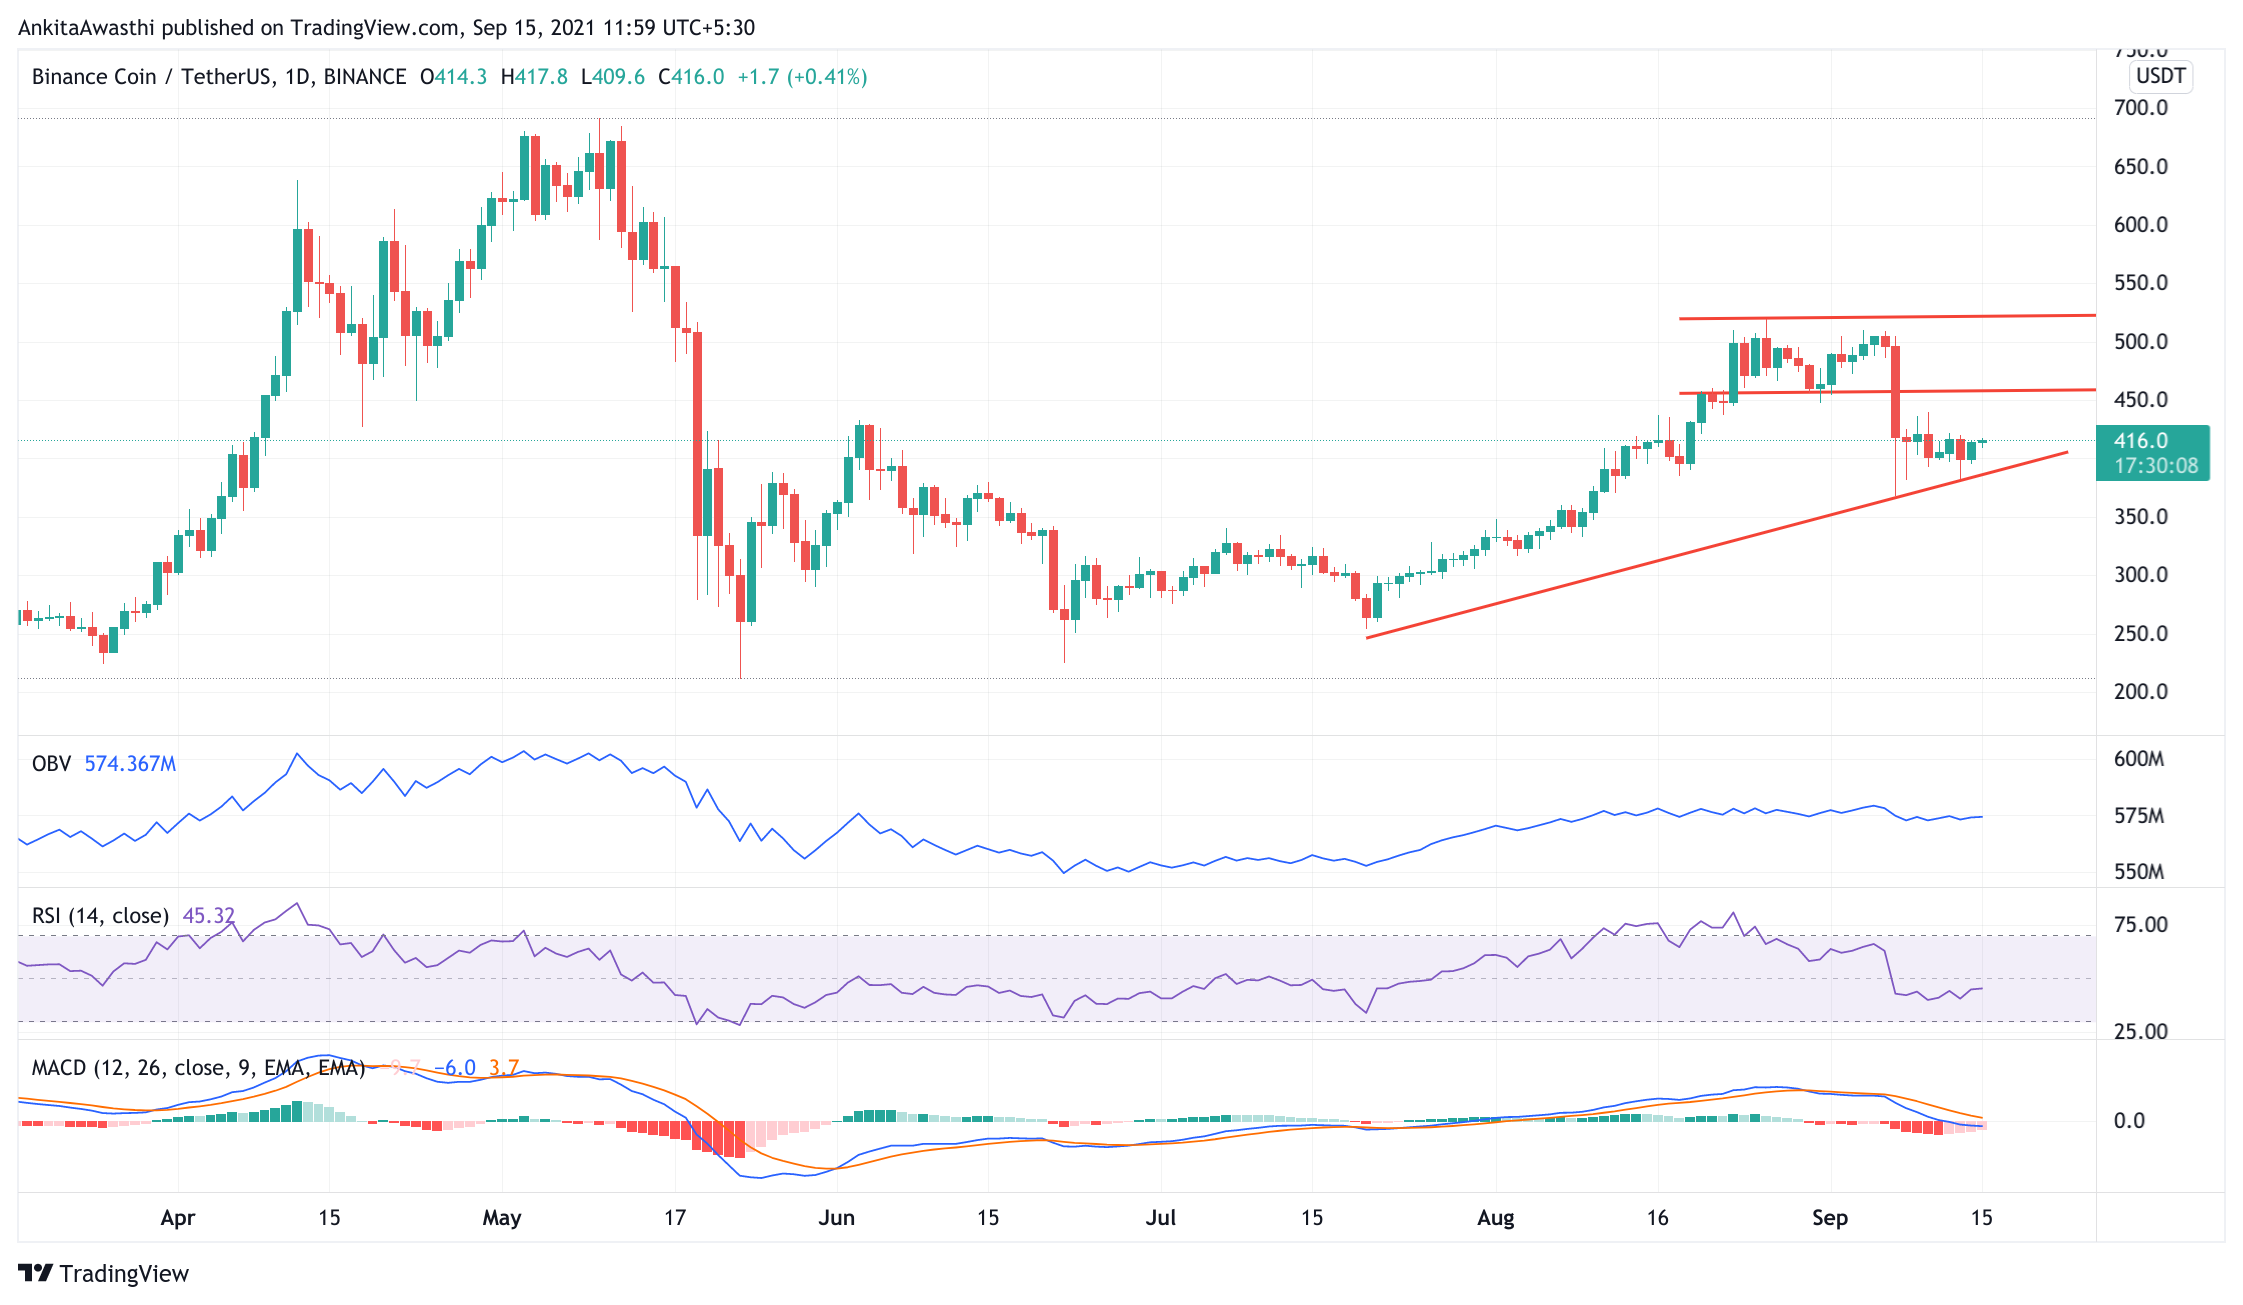
Currently, the MACD and signal are entering the negative zone, that is, below the zero range. Moreover, after forming a bearish crossover by the MACD line over the Signal line. Thus, indicating the overall market momentum is bearish, and we can expect a fall in price for some time.
However, it is at a support level of the bottom trend line. The price can also form its base at these levels and which will keep the MACD line under the zero range. wBNB will require a positive trigger for the pump that will lead to a breakout from this range.
The RSI indicator has bounded from the 40% mark, therefore indicating a short pull back on a daily level. Currently, it is at a 48% mark, it is also denying a bearish divergence. Thus, we can expect the price to rise for the rest of the day. The RSI cool-off can take support at the 38% mark, and we can expect trend reversal from that level.
The OBV can be seen resting at its current level. We can not witness any change in the trend of OBV. The investor’s interest remains constant.
Day-Ahead and Tomorrow
Currently, the price is trading below the Fibonacci pivot point of $433.41. The price can rise from the current level and highlight a new resistance level. As some of the oscillators have shown bearish signals, we can expect the price to fall and test the Fibonacci pivot support level of $380.17 soon. If the price breaks this FIB support level, it will highlight the next support at $323.69. Traders can take a short position.
However, if buyers continue to take control of the market, we will have to closely watch the level of $417.75 as an immediate resistance level. If the price breaks out from this level, it can test the next resistance level of $433.89. Thus, traders can go long between these levels.