
https://www.tradingview.com/x/RfNEpxzI/
Starting in August, trading on the VET market significantly slowed down. This fact does not apply to trading volumes, which are low throughout the local growth wave. We are talking about the VET price growth stopped due to a clear obstacle — the range of $0.0143-$0.0155. Initially, buyers showed serious intentions to take control of this range and close the weekly candle from 30 August without a pin.
However, there was no logical continuation of growth with the final target of $0.0175. It was at this point that we expected the beginning of a new fall wave in the VET market and pointed to this in the previous analysis. But, sellers decided to brazenly test the strength of buyers earlier.
Last week's candle completely absorbed the candle from 30 August and lowered the VET price by 36%. The main liquidity zone, which slowed down the fall, was $0.0095-$0.0105. The instant price rebound from this range and the closing of the weekly candle in half with the pin down gave investors a chance for positive thoughts on the continued growth of the VET market. If buyers manage to keep the range of $0.0095-$0.0105 again without updating the low- a new growth wave will have the final target of $0.0226.
Technical Analysis of VET on the Daily Timeframe
https://www.tradingview.com/x/hZ77IPmq/
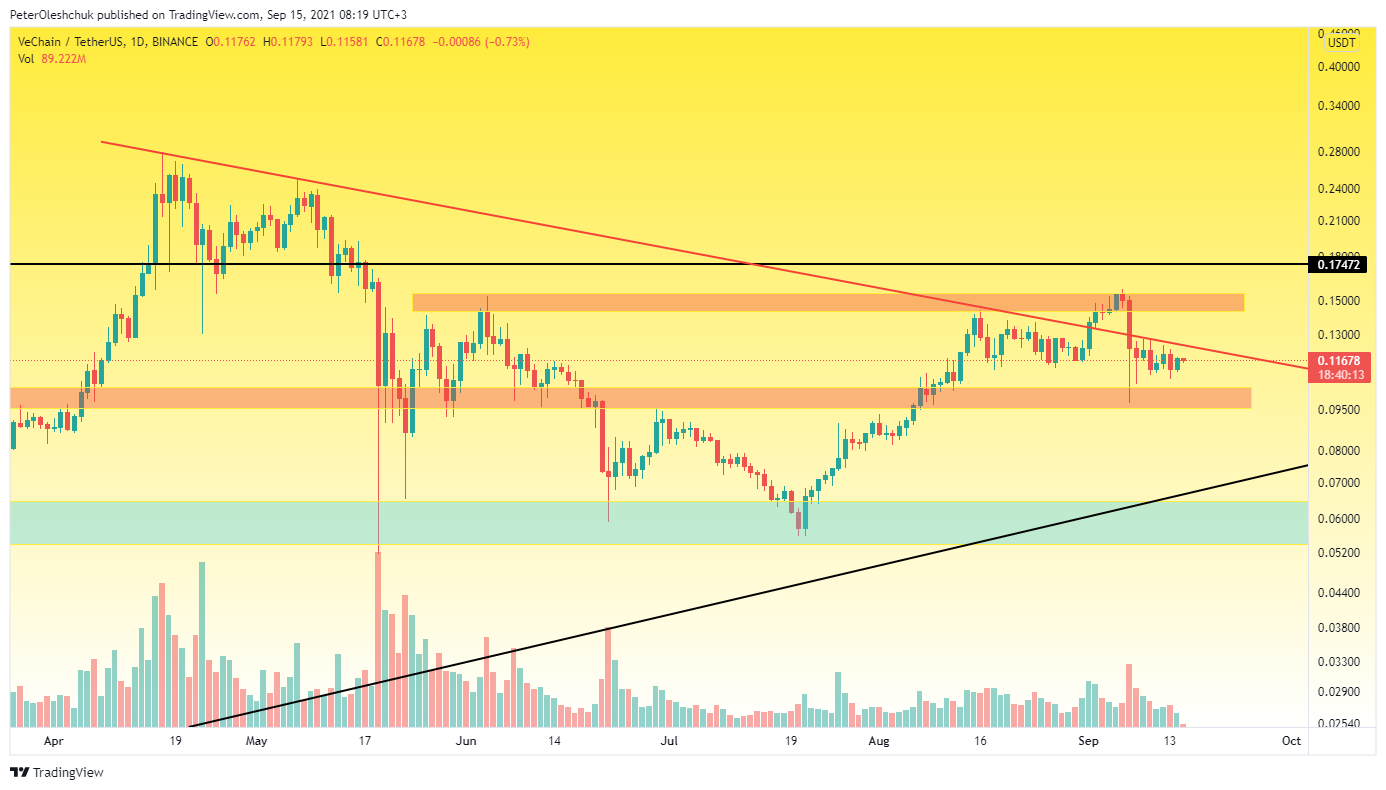
Analyzing the chart on the daily timeframe, you can see that sellers managed to regain control of the trend line, which helped them to form a downward trend. The breakthrough of this trend on 1 September took place on low volumes. During the week, buyers did not arouse interest in entering the market of big money, which provoked a sharp collapse in VET price.
The Vechain price trading range has narrowed as much as possible, and a new VET price shot is expected during September. In the case of taking control of $0.0143-$0.0155, the mark of $0.0175 will be a temporary stop, where it will no longer be necessary to close positions. Now the VET price from 20 May forms a reversible figure, "inverse head and shoulders." Taking control of $0.0143-$0.0155 obviously activates this scenario.
The VETBTC Price Chart Signals a New Growth Wave
https://www.tradingview.com/x/9zpkd2MF/
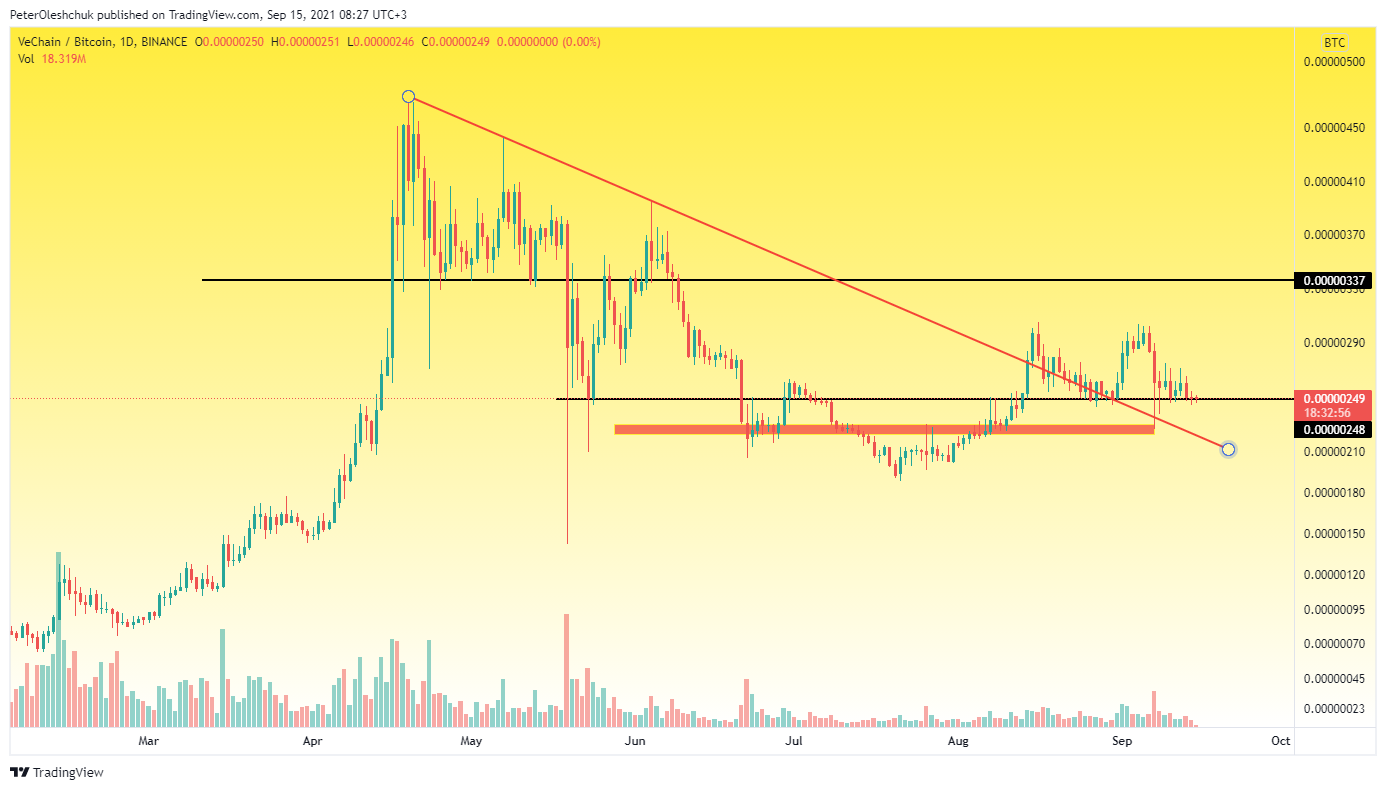
The VETBTC chart also adds a positive sentiment for investors. Buyers managed to get rid of the trend line of sellers. And on the fall of 7 September, buyers tested this trend line from above. Now the price is fixed above the mark of 0.000000248. Starting a new growth wave and taking control of 0.000000272 will open the way for buyers to 0.000000337.