The price of Tezos (XTZ) has more than doubled over the past week. The token is close to breaking the May all-time high of $8.42.
Tezos is growing parabolically
Tezos reached the all-time high (ATH) of $8.42 on May 7, 2021. The altcoin then experienced a 75% correction to a macro low at $2.10 on 20 July.
After a three-month consolidation in May-August, the token broke out above the resistance area near $4 (green rectangle). It then reached the 0.618 Fib retracement of the entire downward movement and turned the $4 resistance into support on September 7.
A day later, the price generated a hammer candle (blue arrow) to start a parabolic upward movement from 9 September. Over the past week, XTZ has doubled in price and is reaching $8 at the press time.
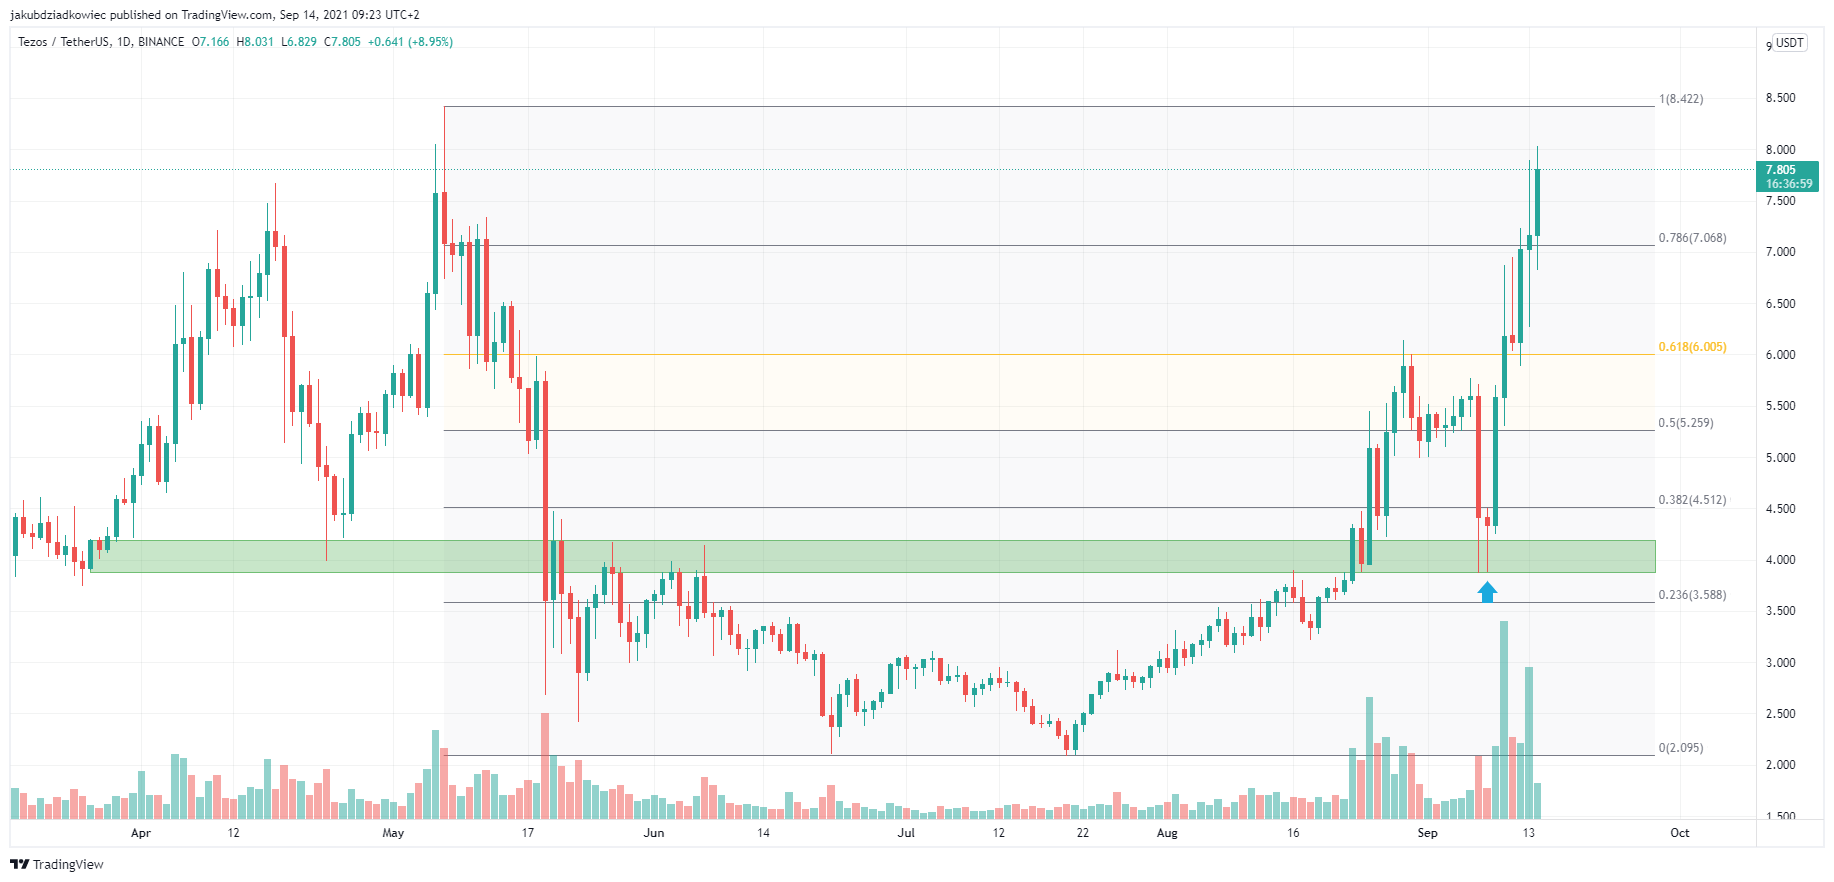
The breakout on 9 September and the subsequent upward movement is confirmed by the record volume. The altcoin then validated the aforementioned 0.618 Fib retracement level into support and continues its upward movement.
Technical indicators
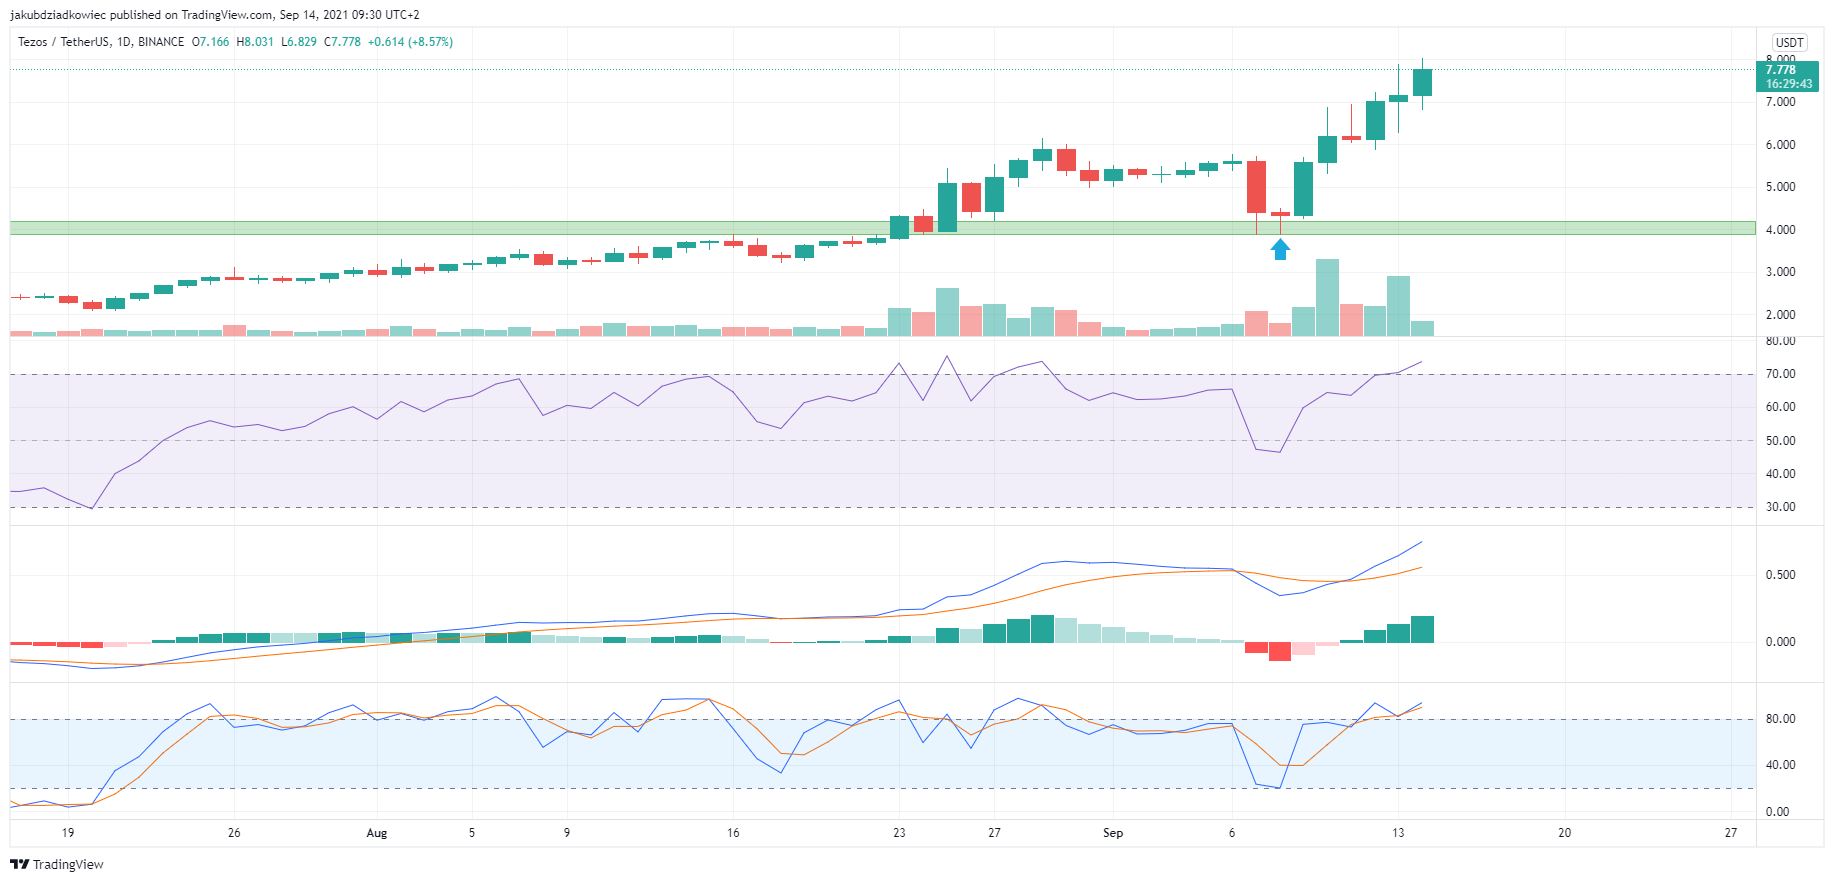
Technical indicators on the daily time frame support the ongoing breakout. The RSI has turned back from neutral territory near 50 and is aggressively heading upwards. Currently, the indicator has regained bullish territory above 70 and is not generating any bearish divergence.
The MACD signal line has been positive since early August and is rising. The momentum bars are green again and indicate an increase in positive momentum. Moreover, the stochastic oscillator has returned to bullish territory after a sharp rebound from the bearish-controlled border.
XTZ future movement
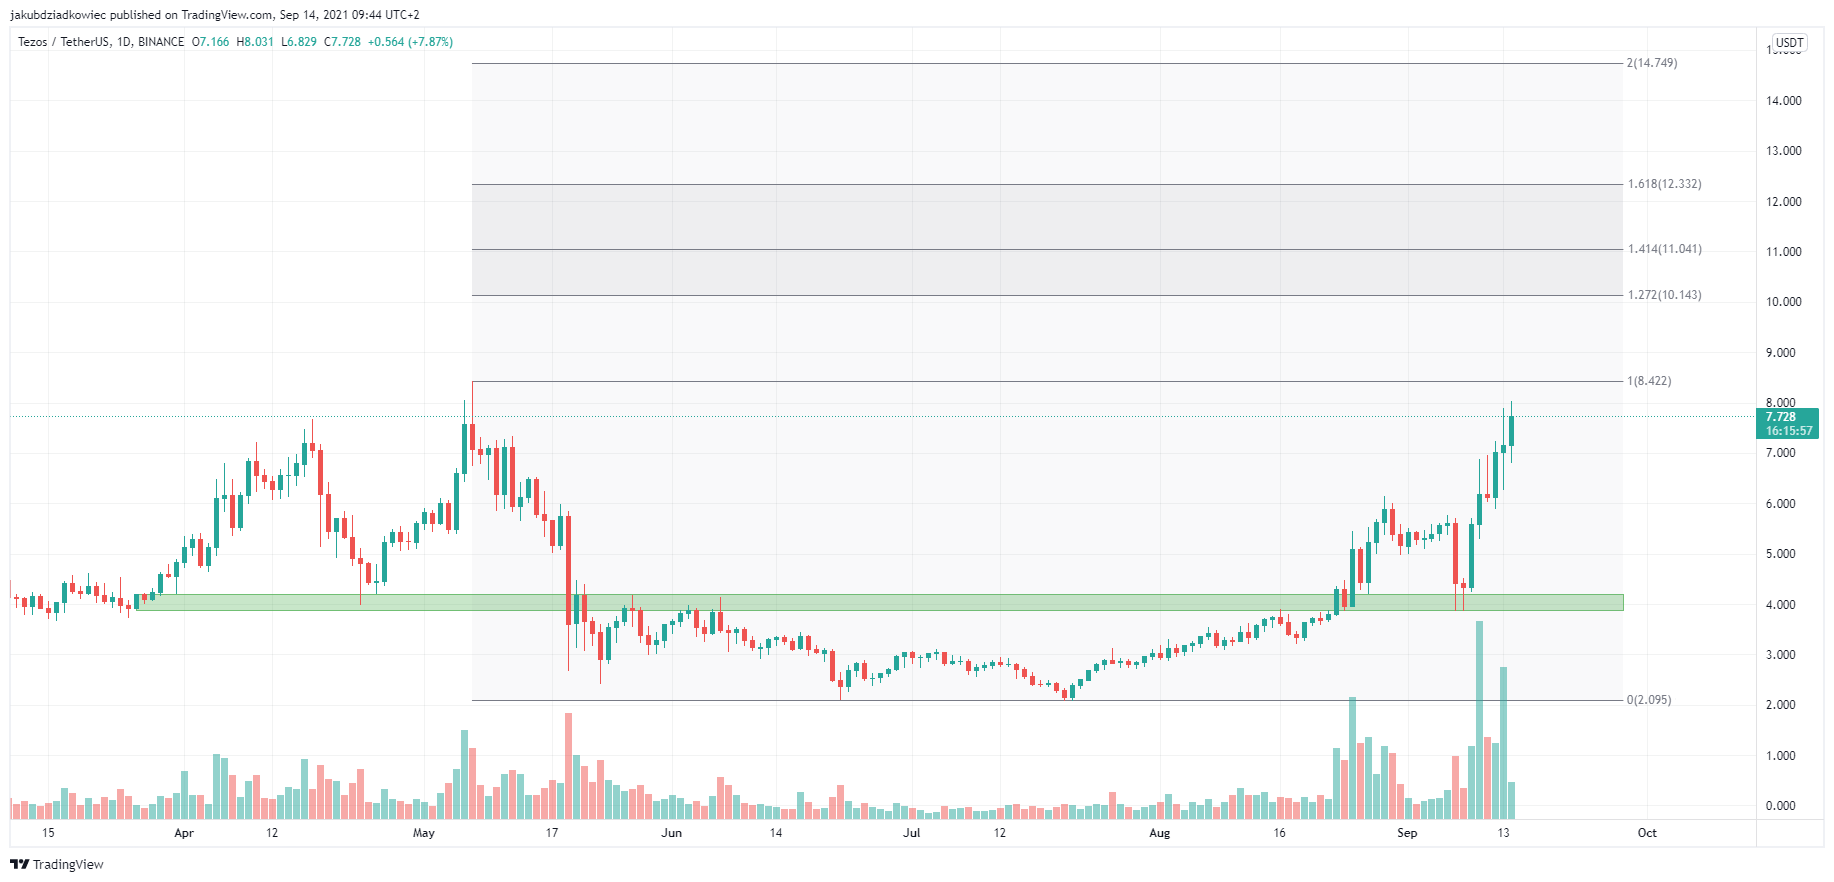
The nearest target for XTZ price action is the ATH level at $8.42. However, even a daily close above the $7.58 area, which is the top of the body of the highest daily candle, would be a bullish signal.
The next targets are determined using the external Fib retracement. After a possible breakthrough of the ATH, XTZ will target $10.14 and $11.04 levels at the 1.272 and 1.414 Fib retracement. If these are broken through, the next resistance levels are at $12.33 and $14.75, which correspond to the external retracement of 1.618 and 2 Fib.
The short-term 4-hour chart shows an aggressively rising parallel channel. At the same time, we see a clear short-term resistance level around $6.20, which has been turned into support (green rectangle).
Currently, the price is near the median of the channel, which has acted as a resistance since September 11. If XTZ manages to break through this resistance line and validate it as support, the next few days could bring a new all-time high.
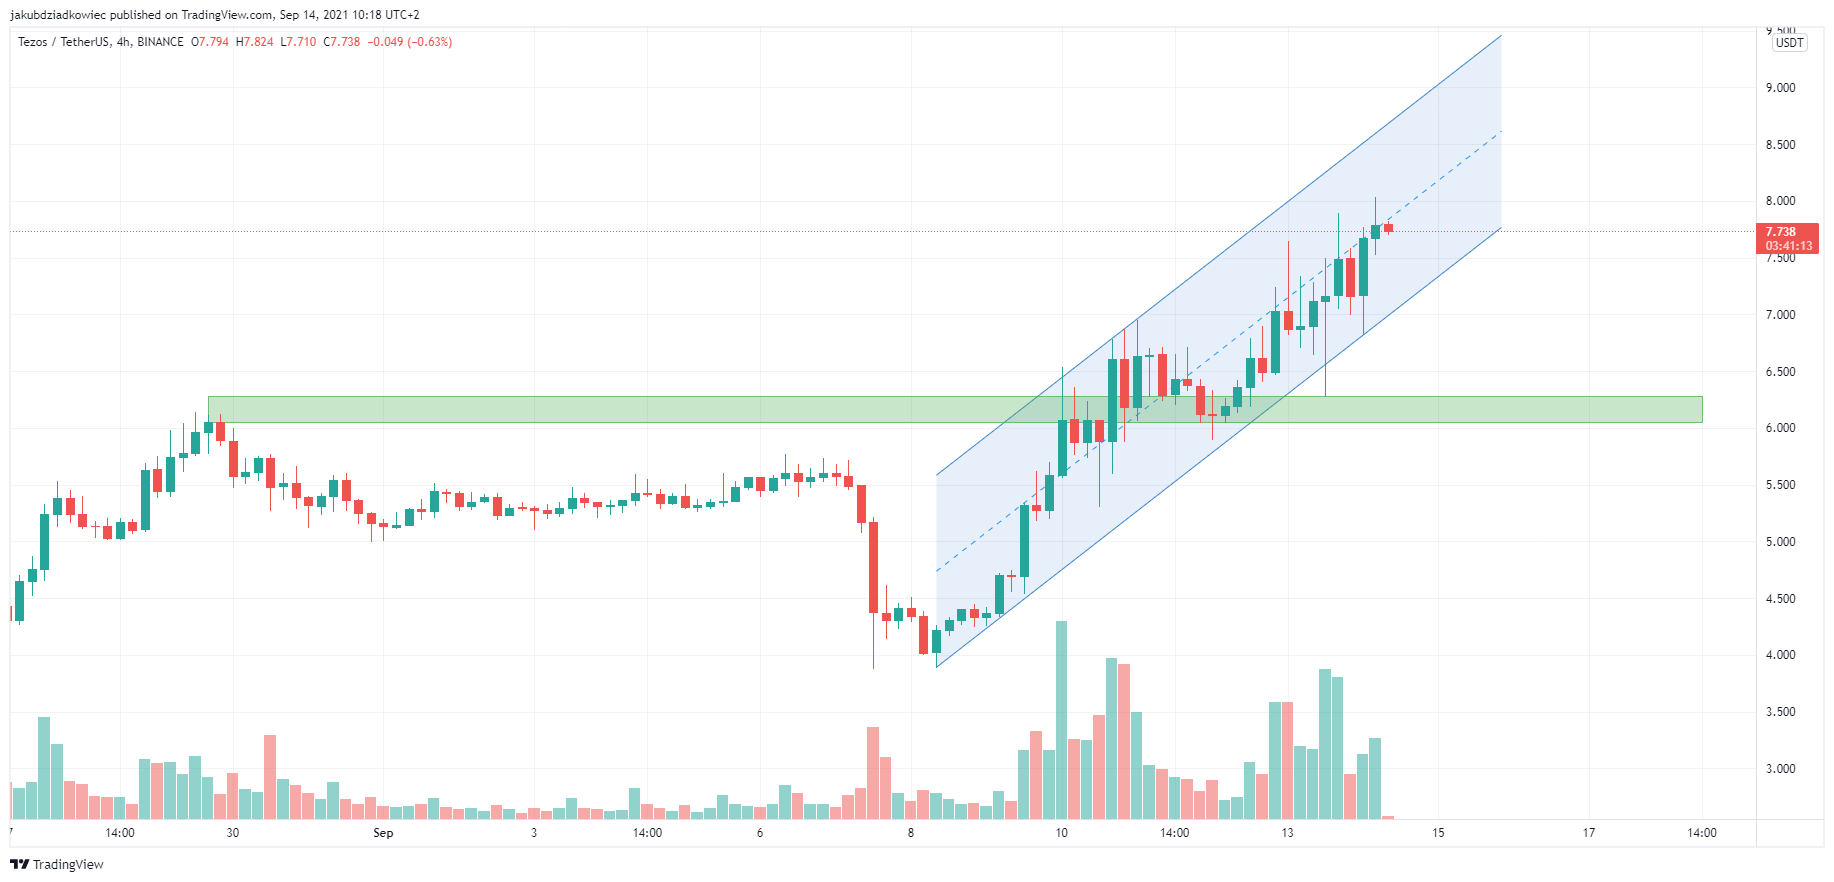
If, on the other hand, the median is still respected as resistance, then the price will return to the support line of the channel, which is currently located around $7. On the other hand, if a breakdown from the parallel channel occurs, the aforementioned $6.20 level will serve as short-term support.