Uniswap (UNI)
The DEX on Ethereum presently manages over $4.9 billion of various assets using UNI for governance.
Past Performance of UNI
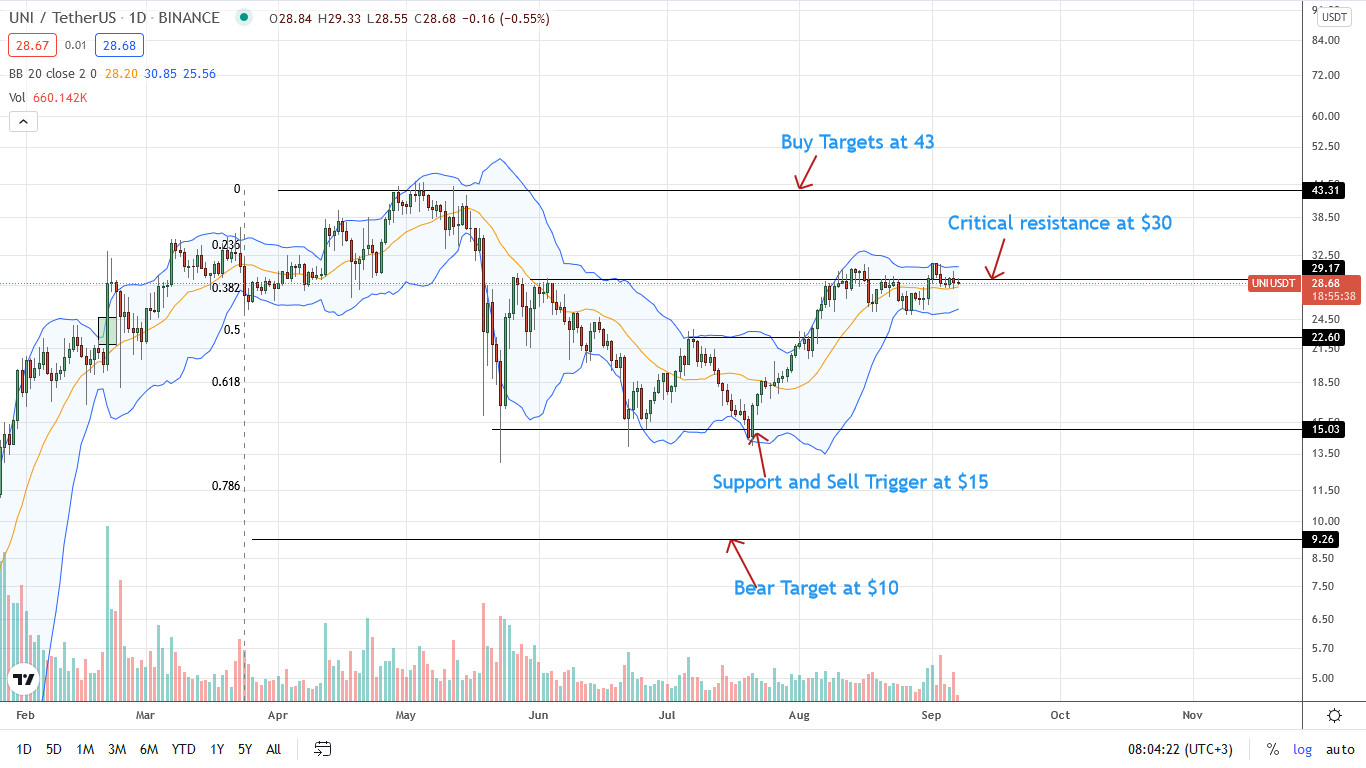
UNI technical analysis in the daily chart shows that the zone between $30 and $31 offers a strong resistance level.
UNI token buyers are in control. A close above $31—August 2021 highs—would realign price action in favor of optimistic buyers.
Presently, Uniswap crypto is steady, dropping slightly against the USD on the last trading day.
Day-Ahead and What to Expect
Overall, UNI coin bulls are in the driving seat. Even so, UNI crypto prices remain in consolidation at around August 2021 highs.
In the days ahead, a reconfirmation of bulls must see prices tear above $31 in a trend continuation.
This would open up Uniswap coin to $45 in the medium term. If not, a contraction below $26 cancels the uptrend, opening doors for even more losses in the immediate term.
Uniswap Technical Analysis
Buyers are in the driving seat.
However, for buy trend continuation, a close above $31 could see another wave of demand lifting the coin at H1 2021 highs of $25.
Even so, there must be a clear trend. In the short term, $25 and the middle BB offer support.
Losses below $25 would halt the uptrend of UNI.
Tezos (XTZ)
The self-amending blockchain Tezos has measures in place to deter unnecessary forks. XTZ is the protocol's native currency.
Past Performance of XTZ
XTZ coin prices are bullish but slowing down.
As momentum wanes, Tezos crypto buyers still have the upper hand, soaking selling pressure.
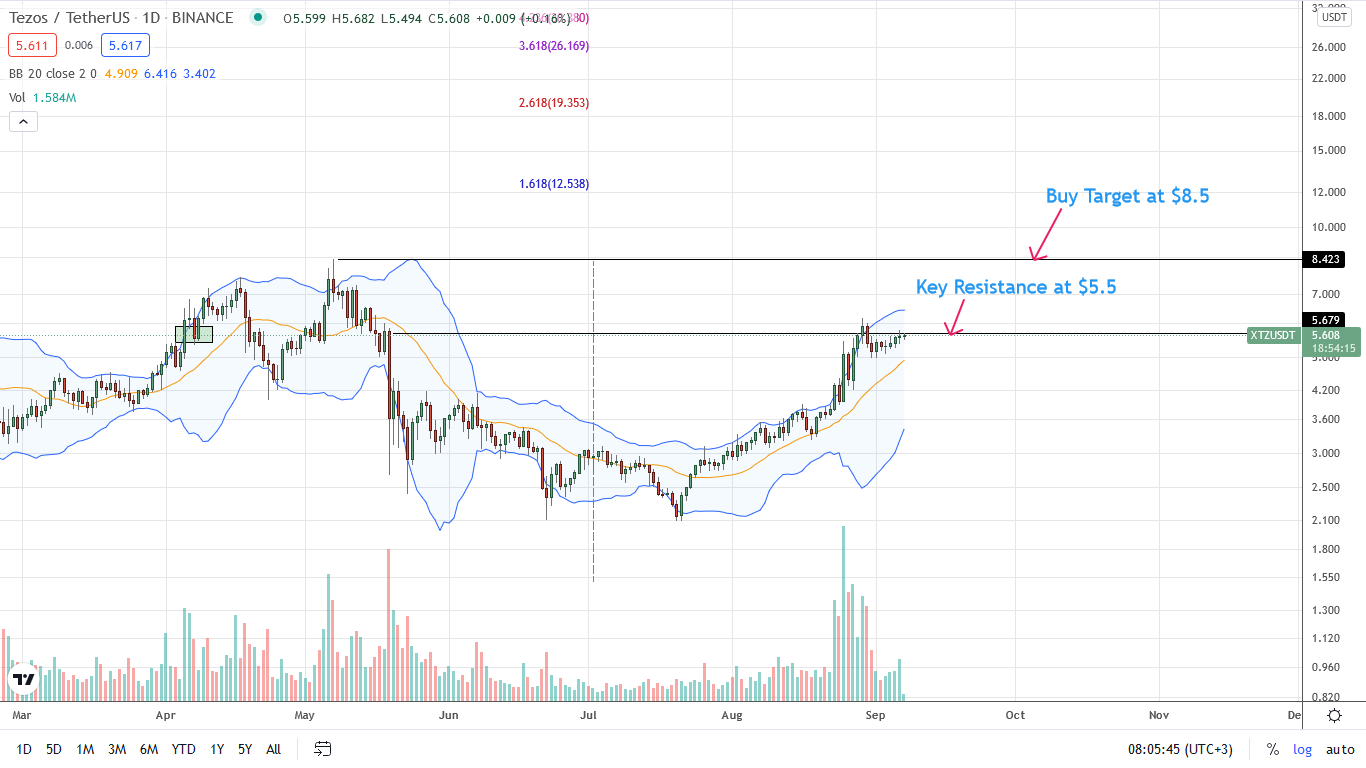
In the days ahead, a substantive close above May 19 highs at $5.5 could see XTZ coin prices race higher.
As of writing, XTZ crypto is up four percent versus the greenback on the last trading day.
Day-Ahead and What to Expect
The path of the least resistance is northwards, at least reading from price action in the daily chart.
Even so, XTZ technical analysis points to consolidation and lower lows versus the upper BB.
Unless there is a confirmed close above $5.5 with rising trading volumes, sellers might unwind gains of the past few days.
Tezos Technical Analysis
The upswing momentum is fizzling as per price action in the daily chart.
May 19 highs of $5.5 present a strong resistance point that Tezos bulls must overcome.
A close above this mark may see XTZ token prices rally to $8.5—retesting H1 2021 highs.
On the reverse side, losses below $5 and the middle BB may force XTZ prices deeper.