CAKE is a DeFi Application that allows traders to exchange tokens, it also provides liquidity via farming, and they can earn fees in return. It is relatively a new cryptocurrency, as it was launched in September 2020. On this platform, PancakeSwap uses an automated market maker where the traders trade against the pooled funds. Let us look at the technical analysis of CAKE.
Past Performance
On August 28, 2021, CAKE started trading at $26.13. As of September 03, 2021, the closing price of CAKE was $23.47. In the last 24 hours, it has traded between $23.17-$23.99. Thus, indicating low volatility in the token. At the time of press, it is trading at $23.42. The token is approximately 1% higher than the days’ opening price. Indicating that the buying pressure is there. Therefore, the market momentum seems bullish for the day.
https://www.tradingview.com/x/P1Q4cE5v/
Day-Ahead and Tomorrow
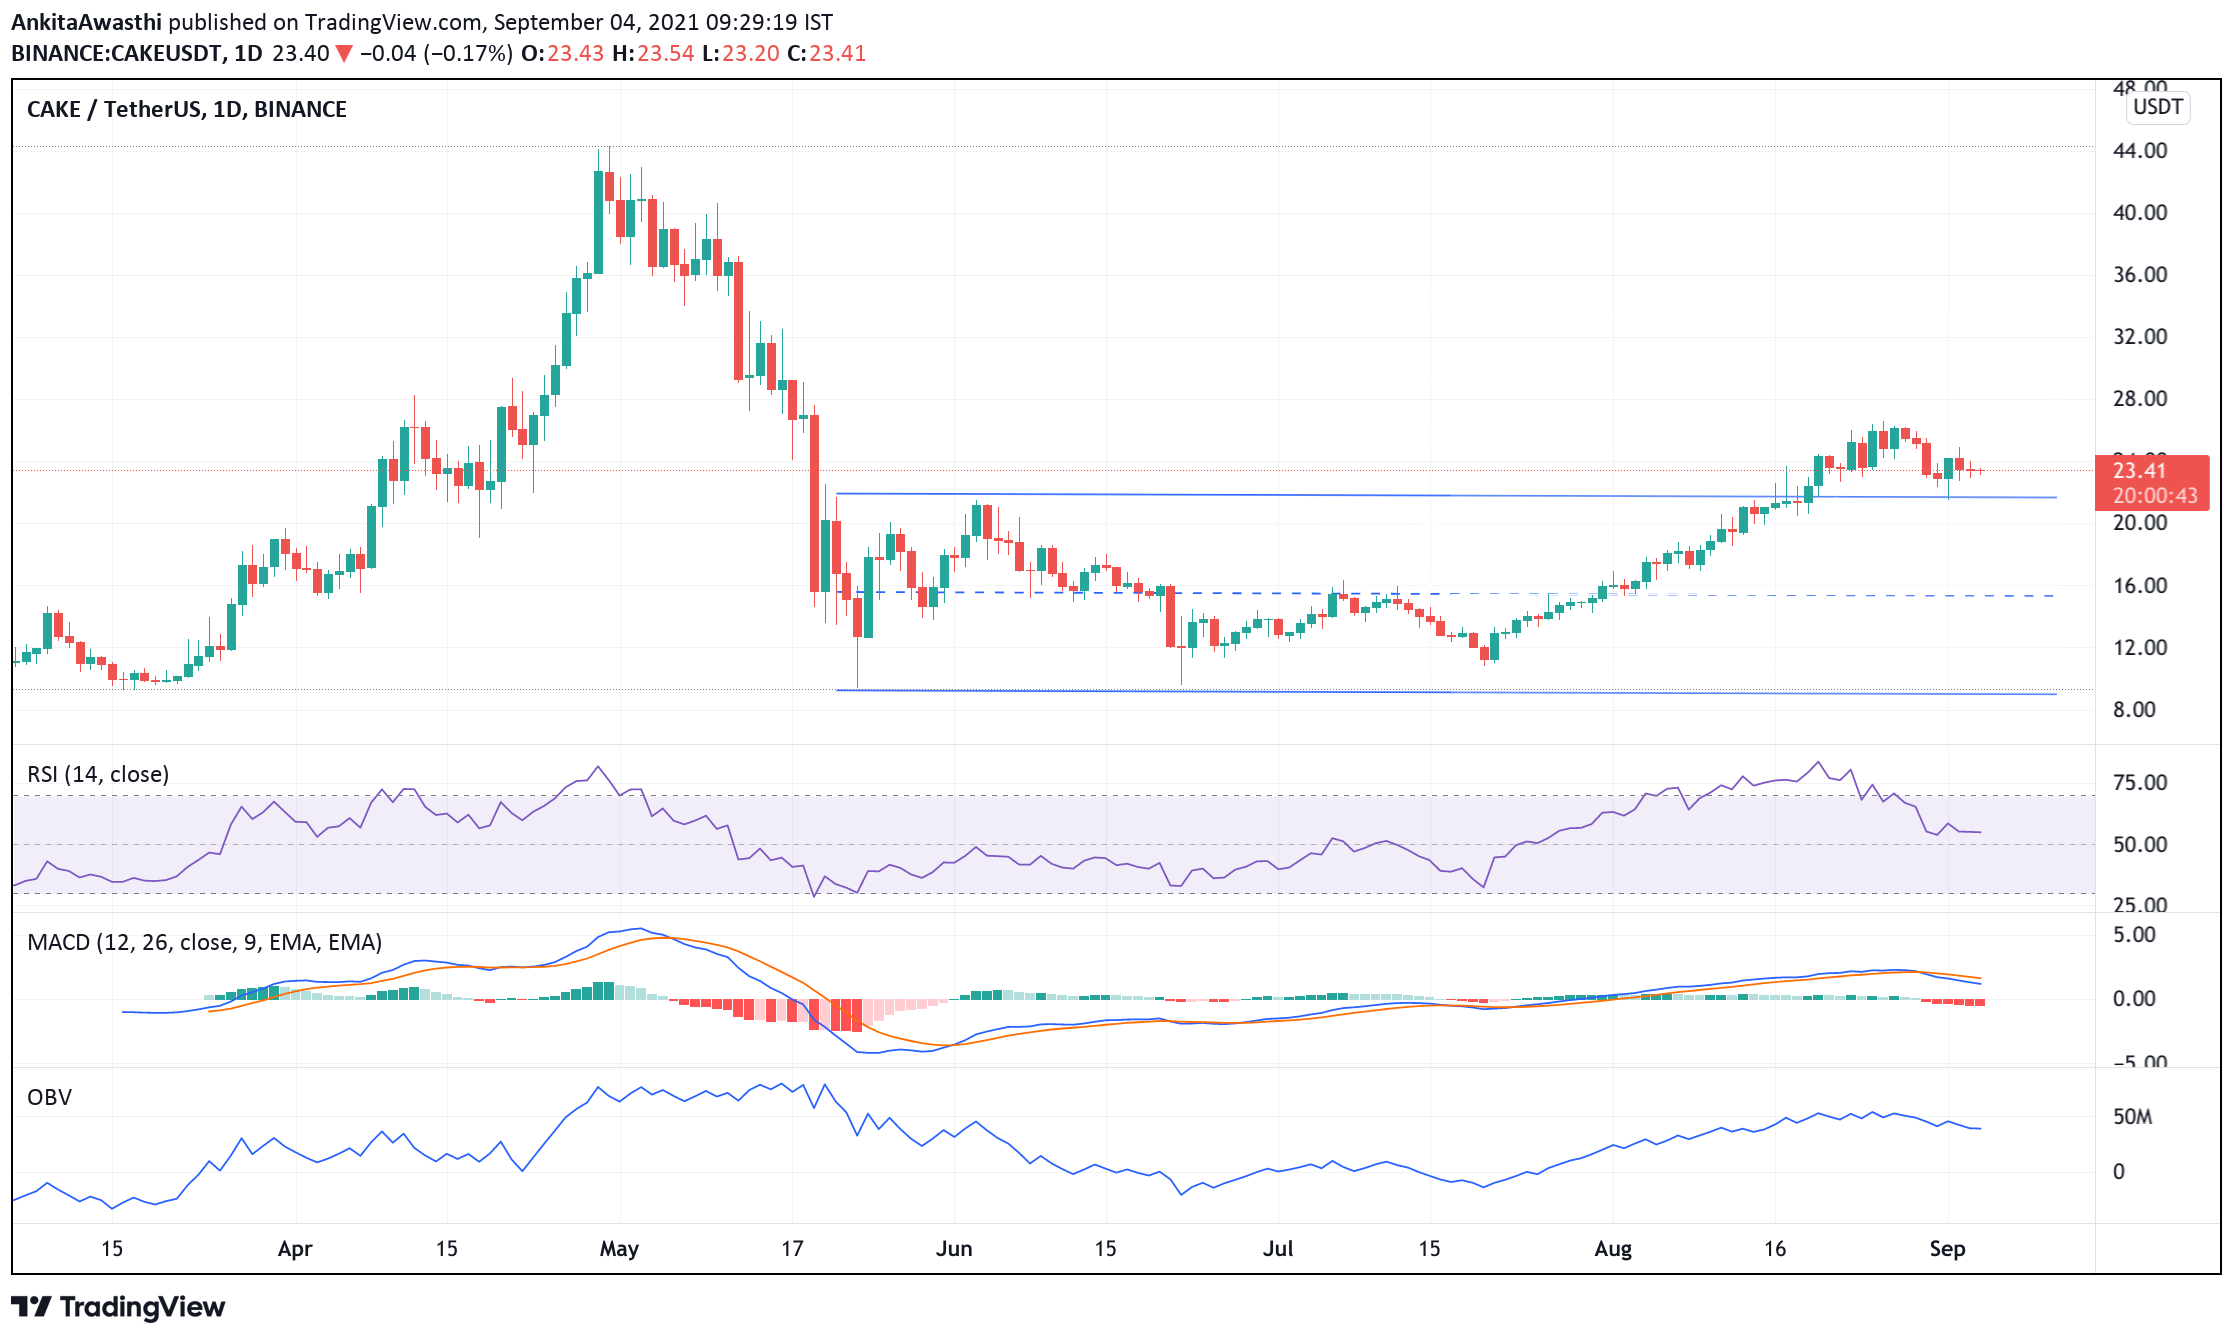
Also, on the daily chart, the MACD and signal lines are moving above the zero range. However, a bearish crossover by the MACD line over the Signal can be seen. Thus, indicating that the price can take a hit for a while.
However, the lines are near to the zero range. Trend reversal might be on the verge. Therefore, we have to wait and watch if the bulls get active and the buying pressure takes on the selling pressure. In that case, the price can break its immediate resistance level at $24.62.
The RSI indicator is at 56.7%, also, it is making a bearish divergence and constantly falling from the level of 82% mark. Thus, if the sellers remain strong for the rest of the day, it will break the support level and further fall. Hence, we can expect the RSI to take the support near the equilibrium and the price will fall for some time.
The OBV has taken a downswing after we saw some price booking on the token.
CAKE Technical Analysis
CAKE is currently trading below the pivot level of $26.70. As the indicators are showing high selling pressure. Thus, we can expect the price to fall and soon, take the support of the Fibonacci level of $22.89. If it breaks down from this level of $22.89, it can test the next support level at $21.27.
In case the buying pressure takes over the selling pressure, then after breaking its resistance at $26.70, the price will highlight the next resistance at $33.06.