Most cryptocurrencies in the market have resumed their uptrend, and some have even posted new all-time highs. Although XRP has remained stagnant over the last two weeks, multiple technical indicators suggest that it is poised to break out imminently.
XRP Primed for Volatility
Ripple’s XRP token looks ready to make a major move.
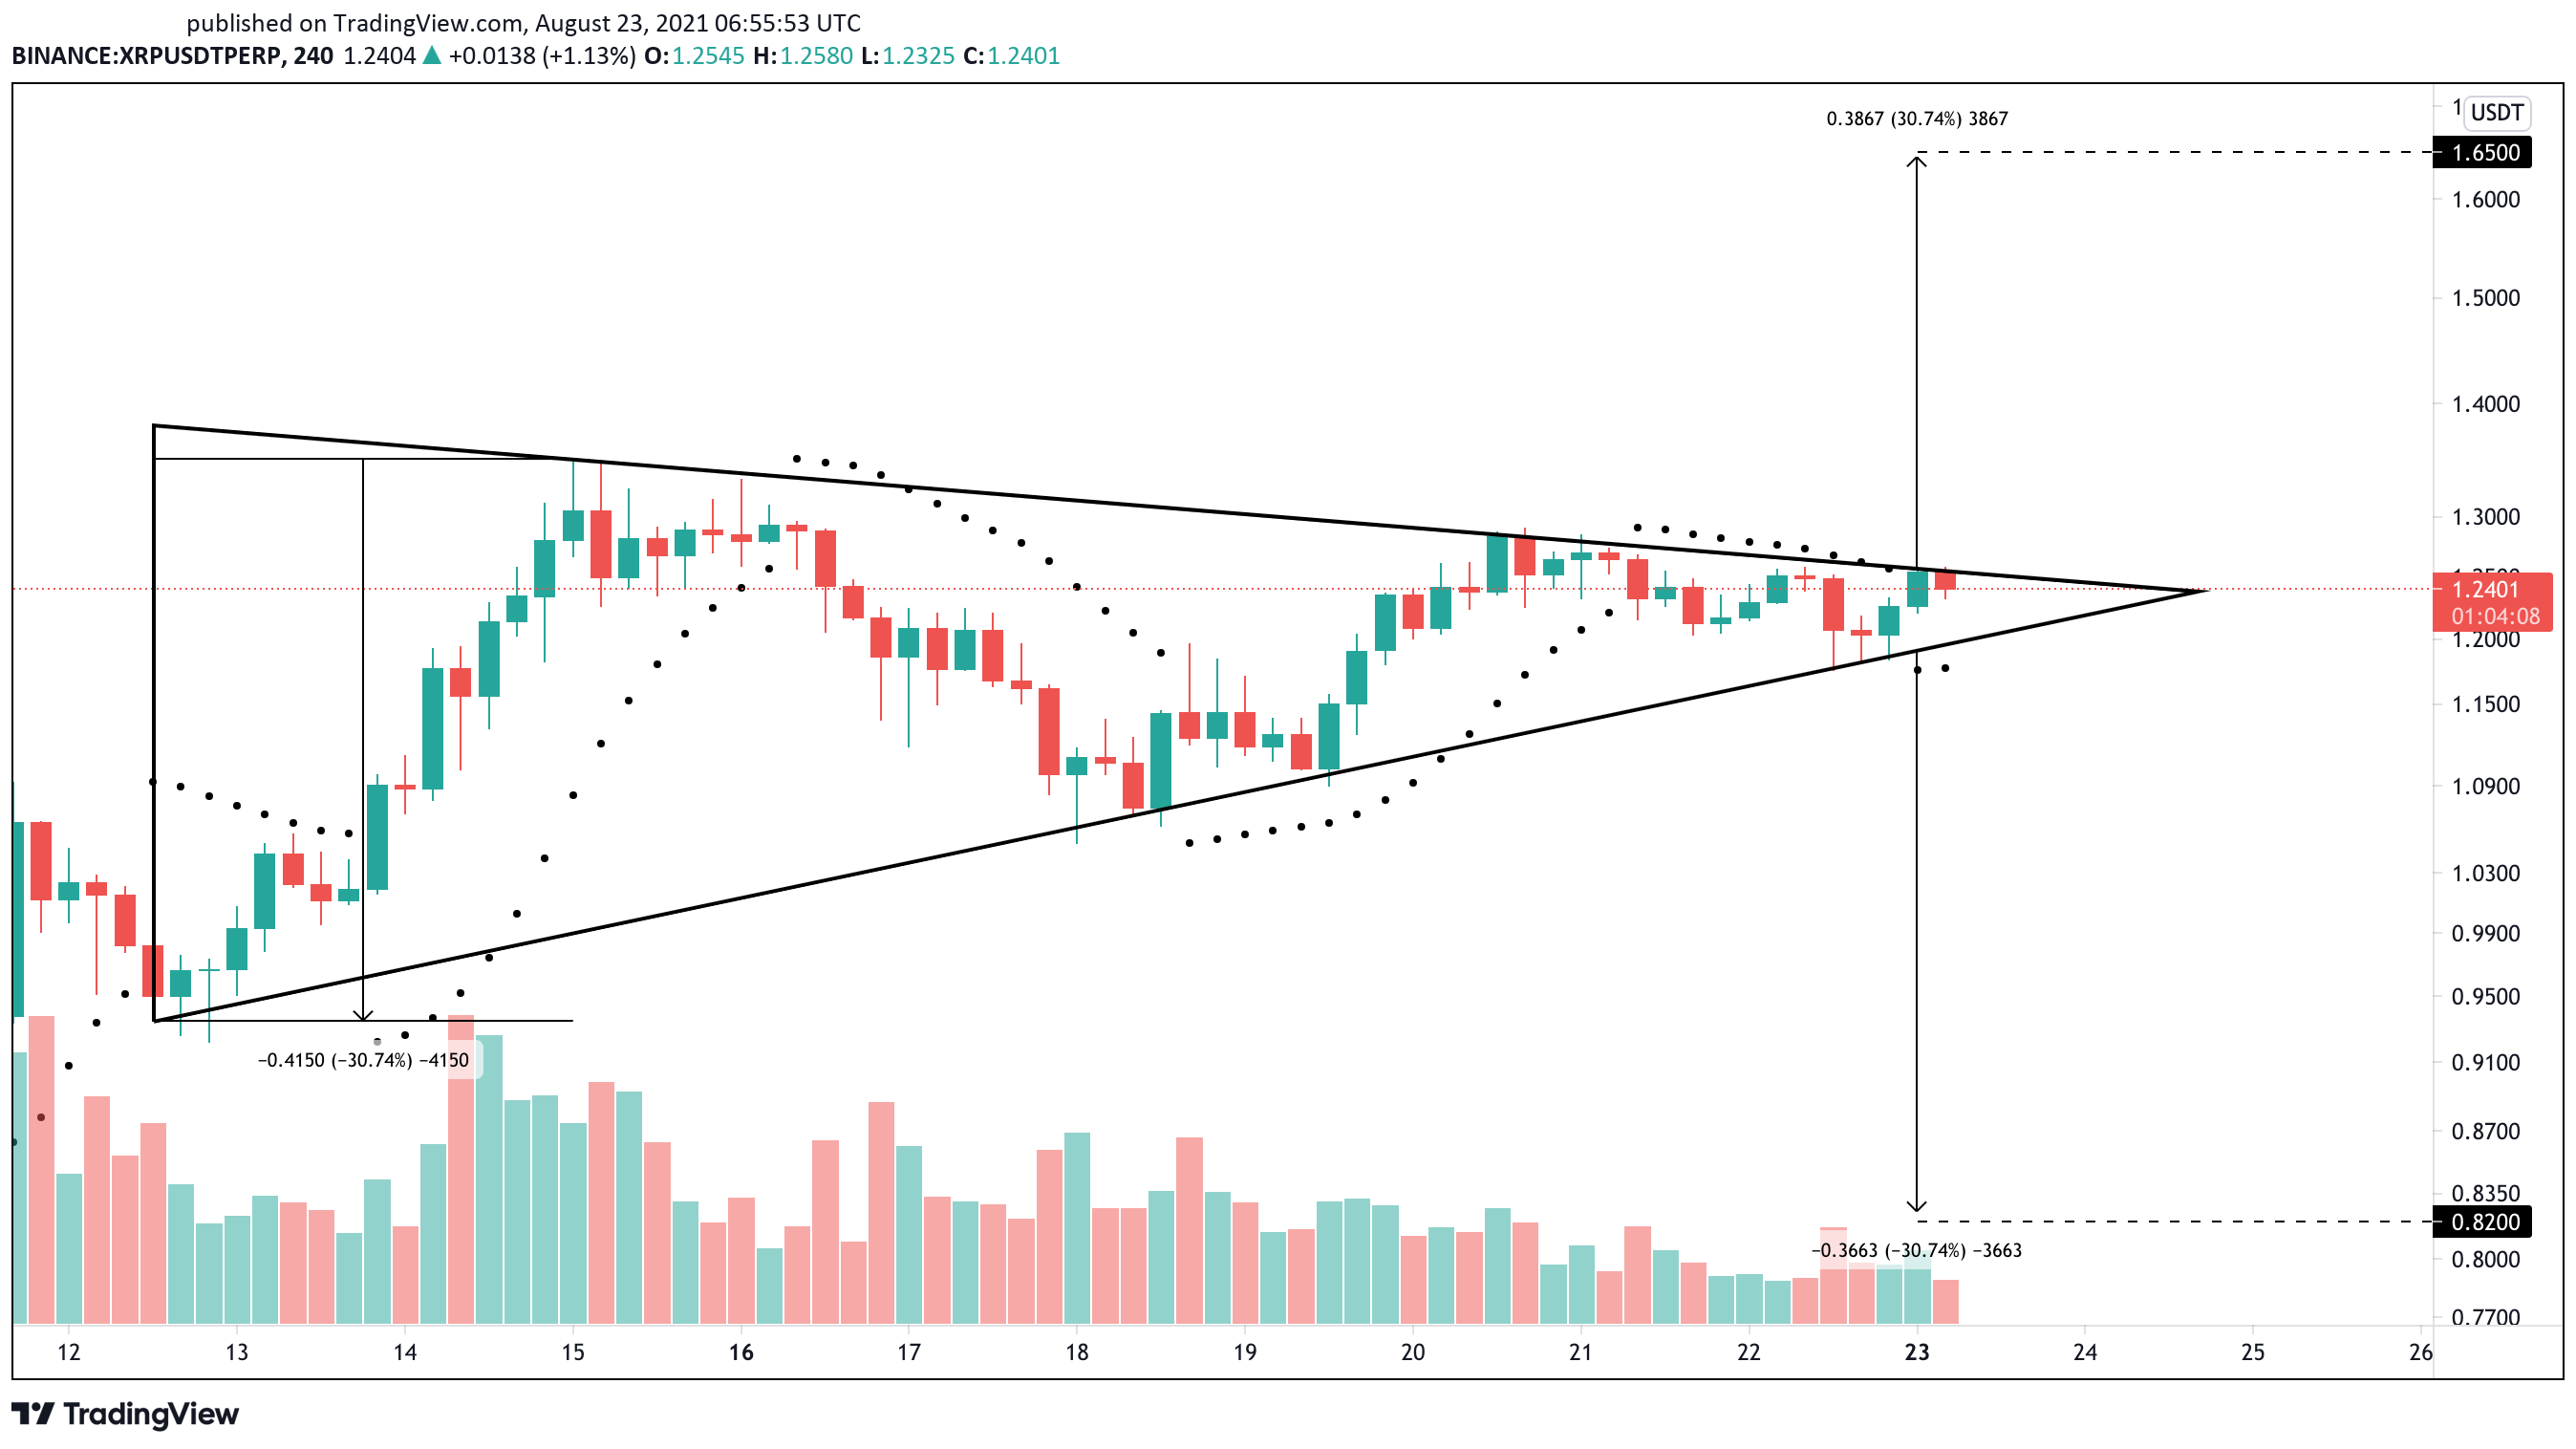
The sixth-largest cryptocurrency by market cap has endured a ten-day-long stagnation period, making a series of lower highs and higher lows. Such price behavior has led to the formation of a symmetrical triangle on its 4-hour chart.
As XRP edges closer towards the triangle’s apex, it signals that volatility is about to strike back. A 30.74% price move would likely follow a 4-hour candlestick close above $1.26 or below $1.18.
This target is determined by measuring the height of the symmetrical triangle’s y-axis and adding it to the breakout point.
Despite the ambiguous outlook that the symmetrical triangle presents, the parabolic stop and reverse, or “SAR,” seems to be leaning toward the positive side. This trend-following indicator forecasts that the downswing seen over the weekend reached exhaustion after moving below XRP’s price on the 4-hour chart.
Historically, the stop and reversal system has been highly effective in determining the course for XRP. The last two times the parabolic SAR flipped from bearish to bullish within the 4-hour chart, XRP’s price dropped by 32.43% and 14.72%.
Similar price action could take place now that the parabolic stop and reverse points have turned bullish. A spike in buying pressure that pushes XRP beyond the triangle’s upper trend line at $1.26 could lead to a 30.74% breakout towards $1.65.
Still, traders must pay close attention to the $1.18 support level as any downswing below it may serve as an invalidation of the optimistic outlook.