In this article, we will take a look at the differences in price movement between the two biggest decentralized finance (DeFi) tokens, Uniswap (UNI) and Chainlink (LINK), in order to determine which coin will outperform the other in August.
Due to the preceding movement and shape of the bounce, LINK seems to have more room for growth in the near future.
UNI
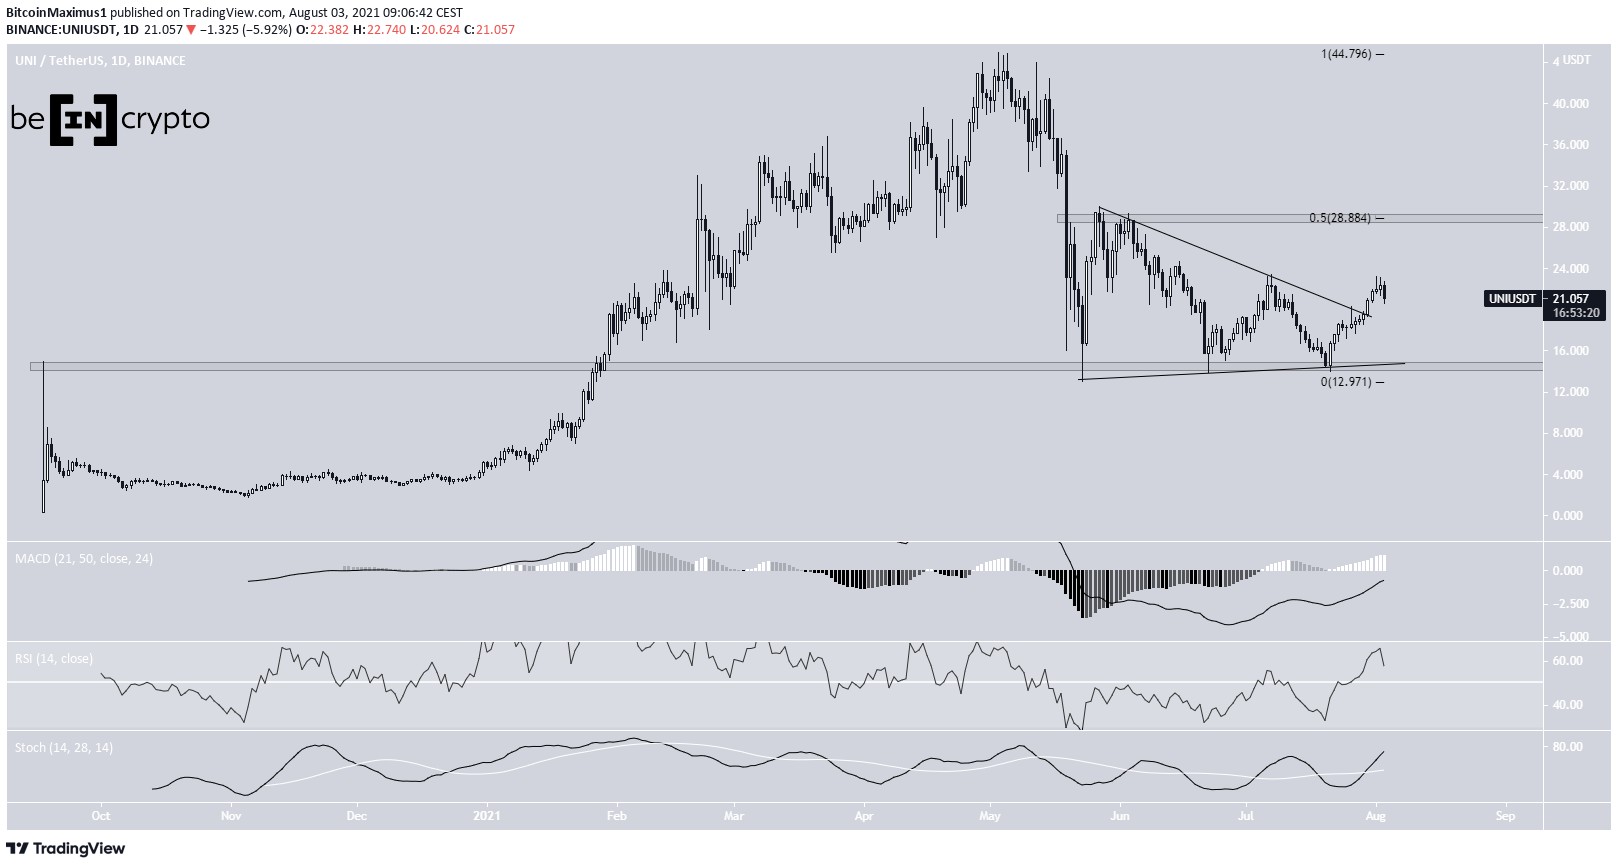
On May 23, UNI reached a low of $13 and bounced. The low left a long lower wick and served to validate the $14.50 horizontal area as support.
The ensuing bounce took UNI to $30 after only four days.
However, the token began to decrease afterwards, creating a symmetrical triangle in the process.
After two more bounced at the support line of the triangle and $13 support area, LINK broke out from the pattern on July 30 and has been moving upwards since.
So far, it has managed to reach a high of $23.22, doing so on Aug. 2.
Technical indicators in the daily time-frame are bullish. The RSI has crossed above 50, the Stochastic oscillator has made a bullish cross and the MACD is increasing, nearly moving above the 50 line.
The closest resistance area is at $28.85, the 0.5 Fib retracement resistance level.
LINK
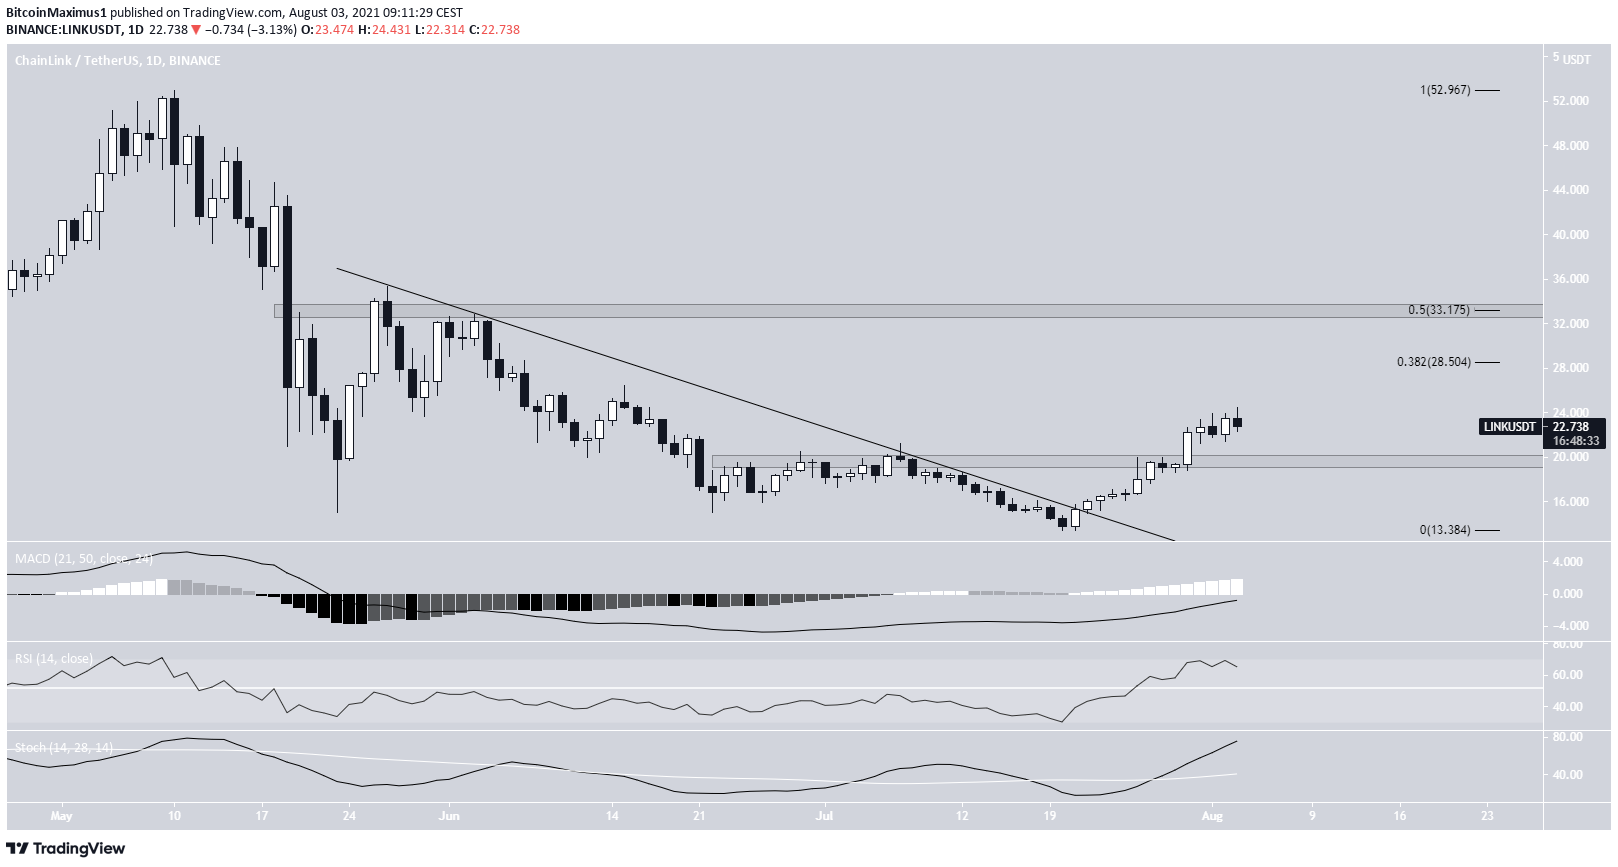
On May 23, LINK reached a low of $15 and bounced. It managed to reach a high of $35.33 four days later.
However, it began to decrease almost immediately afterwards, following a descending resistance line. This led to a low of $1338 being reached on July 20. Therefore, unlike UNI, LINK eventually created a lower low relative to the price on May 23.
Shortly afterwards, the token managed to break out from the descending resistance line. On July 30, it managed to reclaim the $20 area, which is now likely to act as support.
Technical indicators in the daily time-frame are bullish. The Stochastic oscillator has made a bullish cross, the RSI has moved above 50 and the MACD is nearly positive. The readings are almost identical to those of UNI.
The closest resistance is at $28.35, the 0.382 Fib retracement resistance level. There is very strong resistance at $32.95, the 0.5 Fib retracement resistance level and a horizontal resistance area.
UNI vs LINK
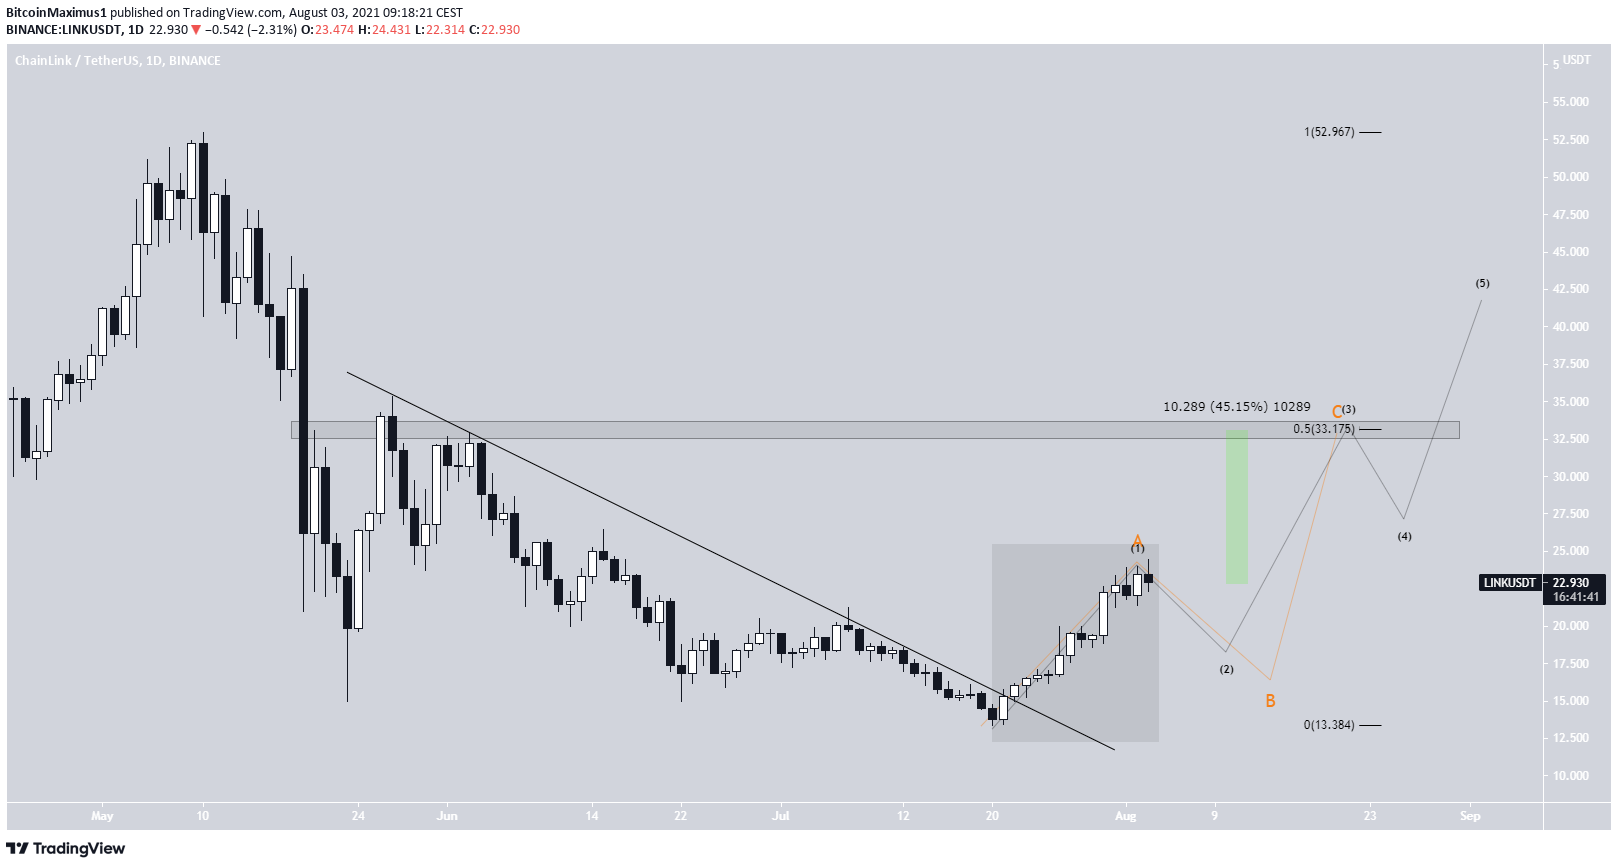
The fact that LINK has made a lower low relative to the May 29 price actually bodes better for its future movement.
It indicates that the movement beginning on July 20 is either a new bullish impulse (black) or an A-B-C corrective structure (orange).
In any case, an eventual movement at least to the $33.17 resistance area would be likely. Measuring from the current price, it would amount to an upward movement of roughly 45%.
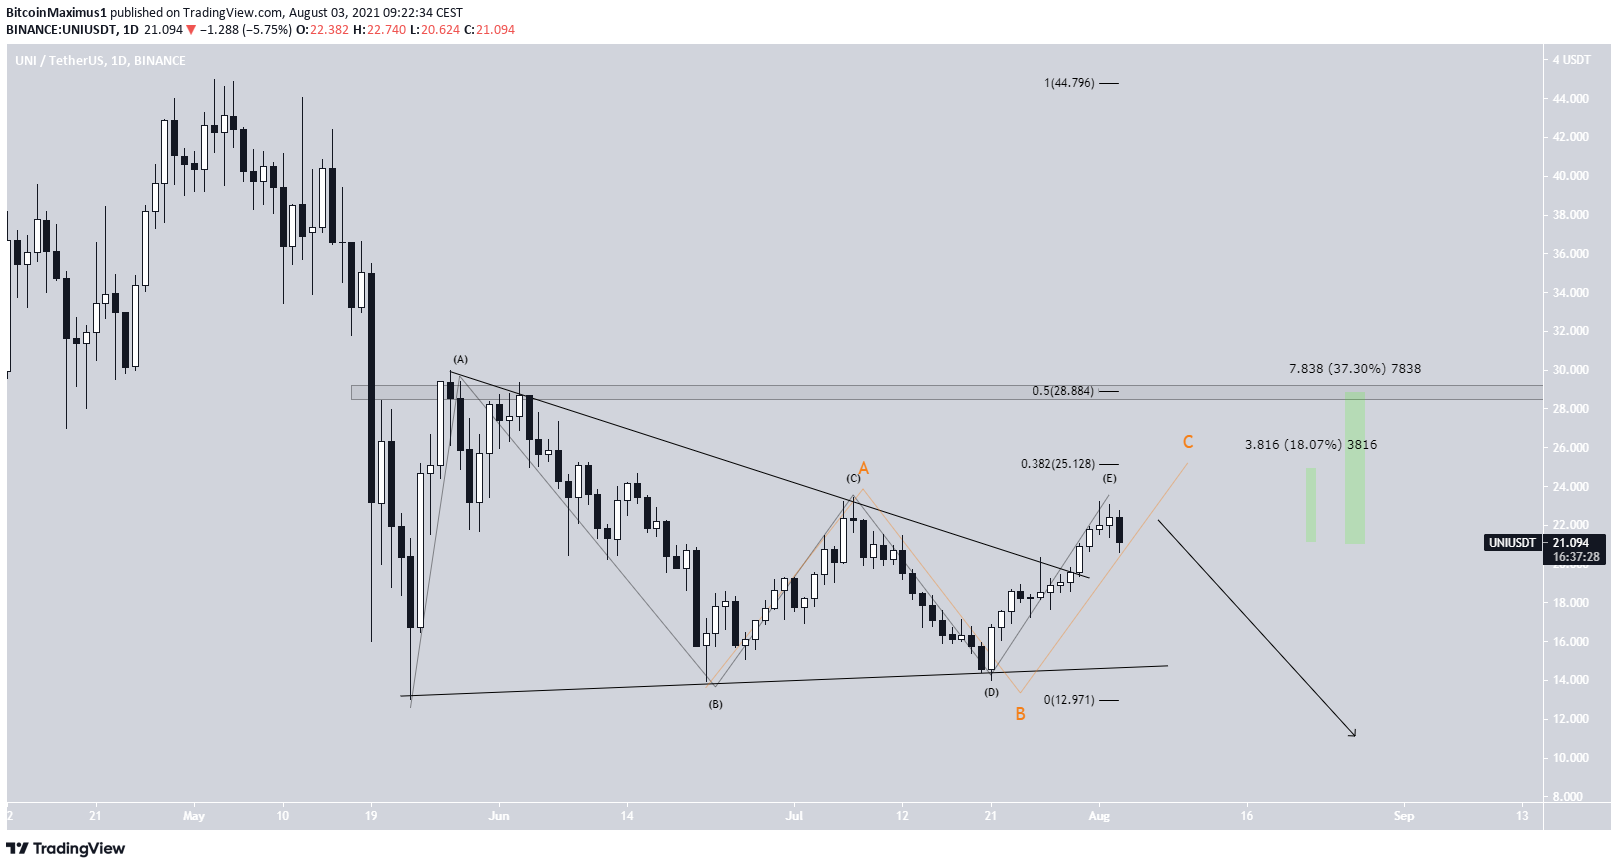
Conversely, the presence of the triangle and lack of a lower low in UNI leaves numerous potential counts in play, the majority having the token near the end of a corrective structure.
An A-B-C-D-E triangle (black) would indicate that UNI has completed its bounce and will now move downwards.
Conversely, it is possible that UNI is in an A-B-C corrective structure (orange), which would end near the $25.12 resistance area, an increase of 18% from the current price.
Even if UNI were somehow to increase all the way to the 0.5 Fib retracement resistance level, it would still be an upward movement of 37.30%, less than that of LINK.