Axie Inifinity (AXS) reached a new all-time high price of $53.50 on July 27, potentially completing a bullish impulse.
Smooth Love Potion (SLP) has made a double top pattern and is searching for support.
The Sandbox (SAND) has broken out from a descending resistance line and reached the $0.78 resistance area.
AXS
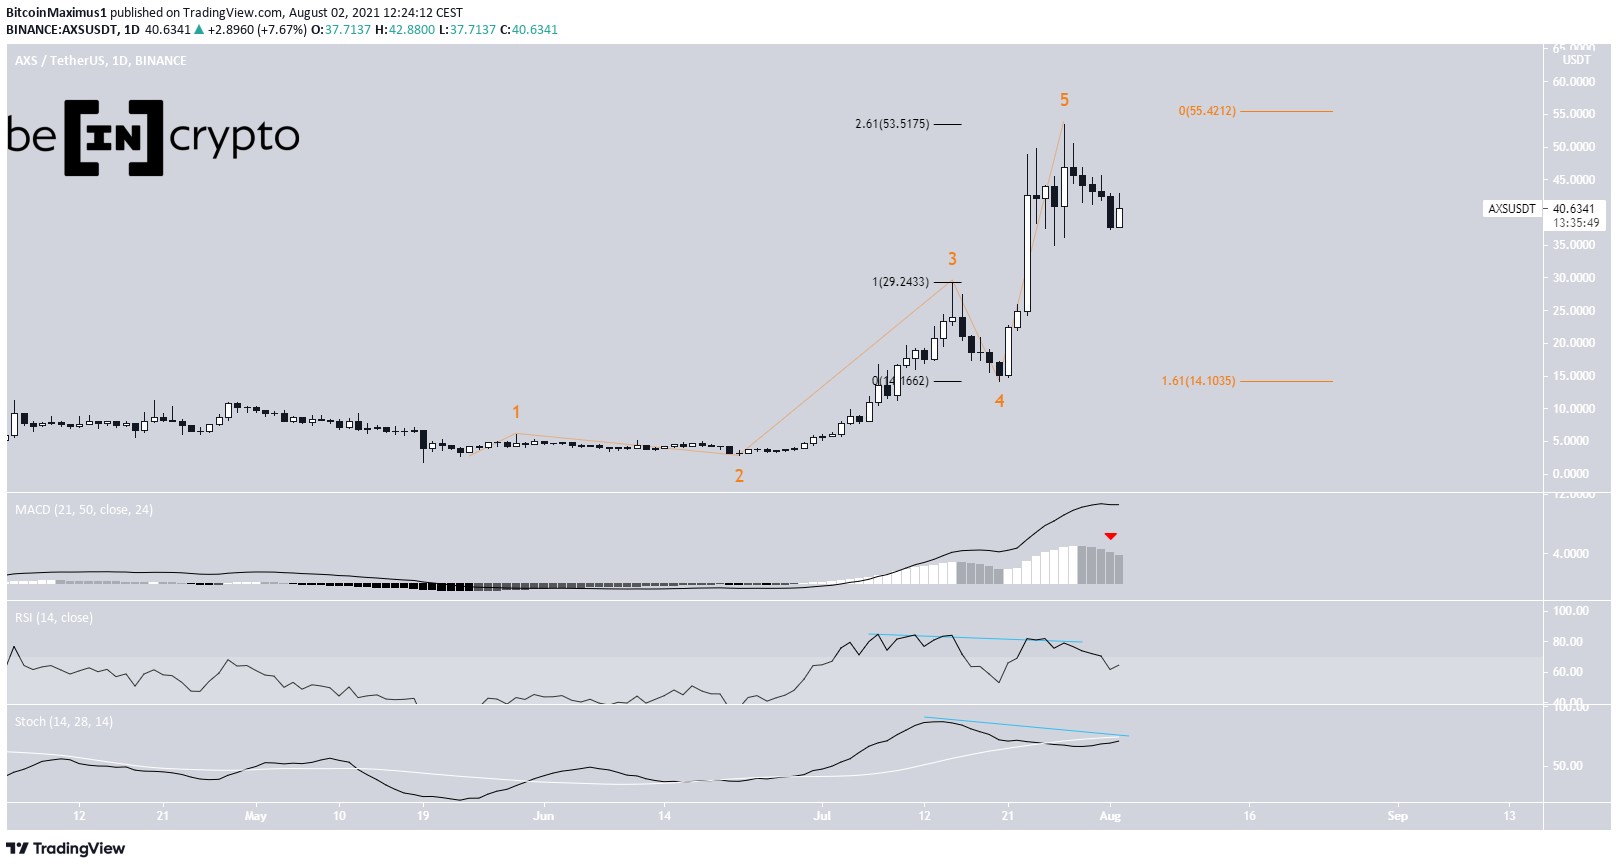
AXS has been moving upwards at an accelerated rate since July 20. The increase continued until July 27, when a new all-time high of $53.5 was reached.
The movement looks like a completed five wave bullish impulse (orange).
The high was made at a confluence of Fib resistance levels that signify a potential top is near. The Fib levels are the 2.61 external Fib retracement of wave four (black) and the 1.61 Fib projection of waves 1-3 (orange).
In addition to this, technical indicators are showing weakness. The MACD has given a bearish reversal signal. The RSI and Stochastic oscillator have generated bearish divergence, the latter having made a bearish cross.
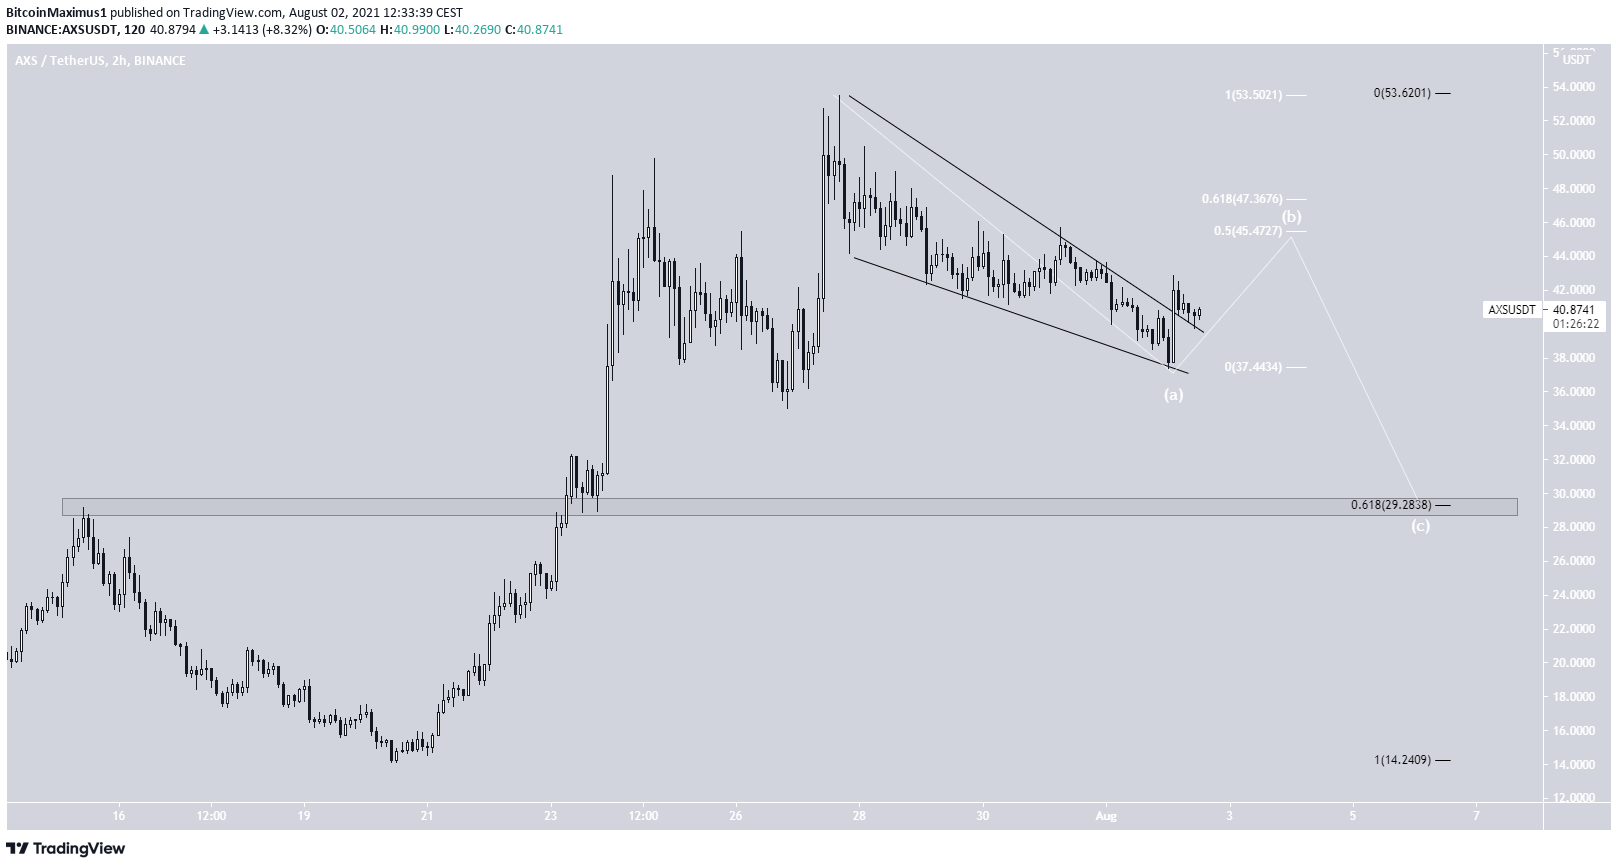
The shorter-term two-hour chart shows that the decrease from the all-time high took the shape of a descending wedge, from which AXS has now broken out. The movement could have been a leading diagonal as part of sub-wave A (white).
If correct, the token will increase towards the 0.5-0.618 Fib retracement resistance levels before dropping once more.
The main support area is at $29.30, the 0.618 Fib retracement support level and a horizontal support area.
Highlights
- AXS reached a new all-time high on July 27.
- There is support and resistance at $29.30 and $45.50, respectively.
SLP
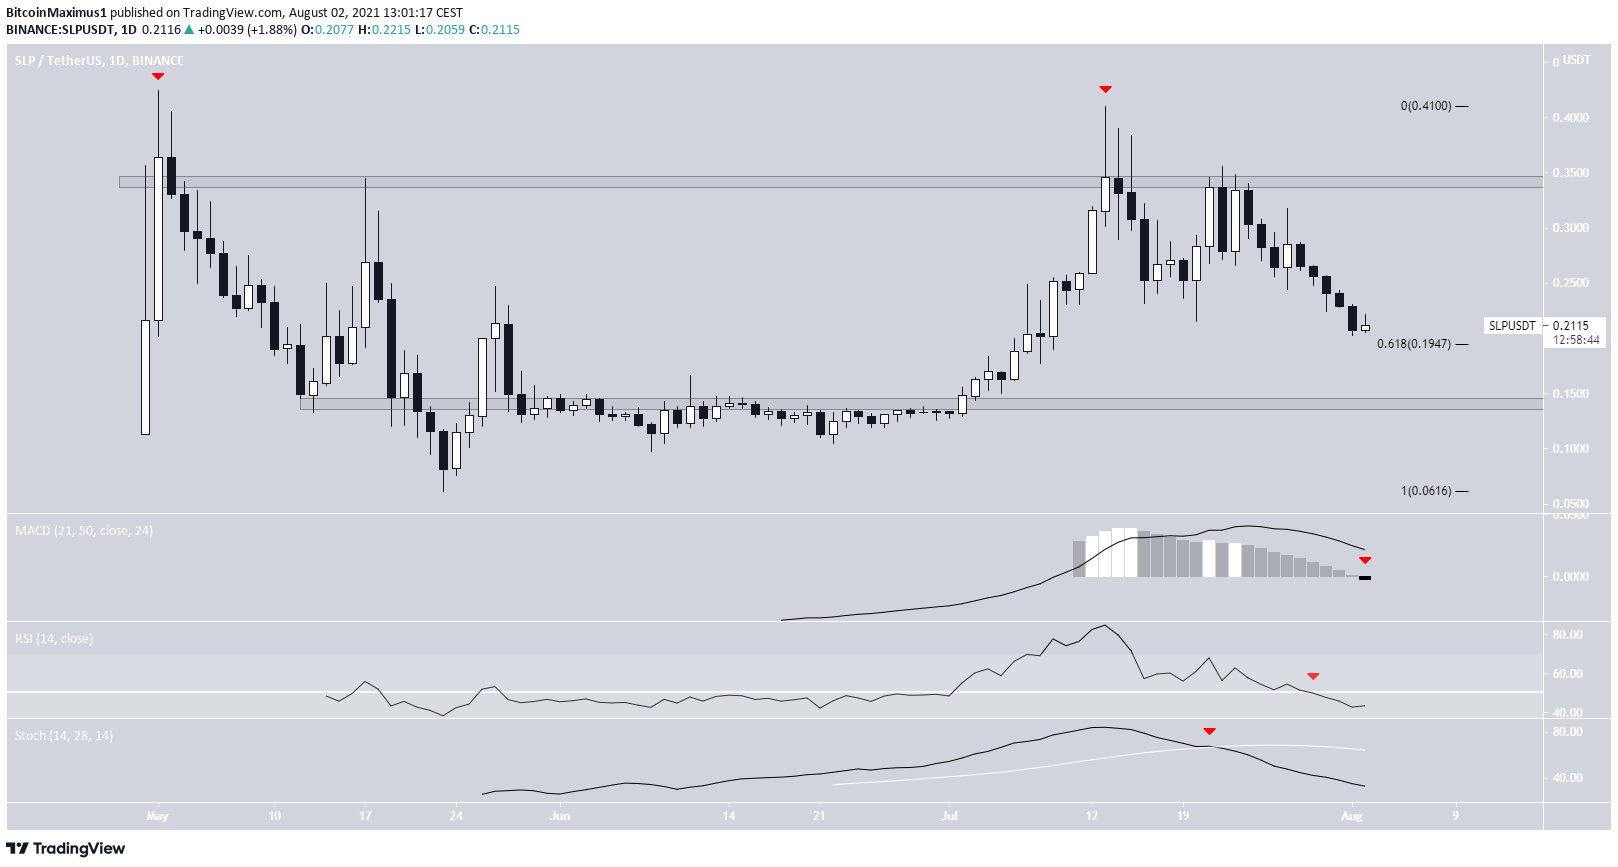
On July 13, SLP reached a high of $0.41. The high was made above the $0.34 horizontal resistance area.
However, the token failed to close above this area and decreased below it instead. On July 22, it created a lower high, validated the area as resistance and has been moving downwards since.
Furthermore, the high created a double top pattern relative to the price in the beginning of May.
Currently, SLP is trading just above the 0.618 Fib retracement support level at $0.195. A breakdown below this area could trigger a sharp drop towards $0.145.
Technical indicators in the daily time-frame are bearish. The RSI has fallen below 50, the Stochastic oscillator has made a bearish cross and the MACD is nearly negative.
Highlights
- SLP has made a double top pattern.
- There is resistance and support at $0.34 and $0.195.
SAND
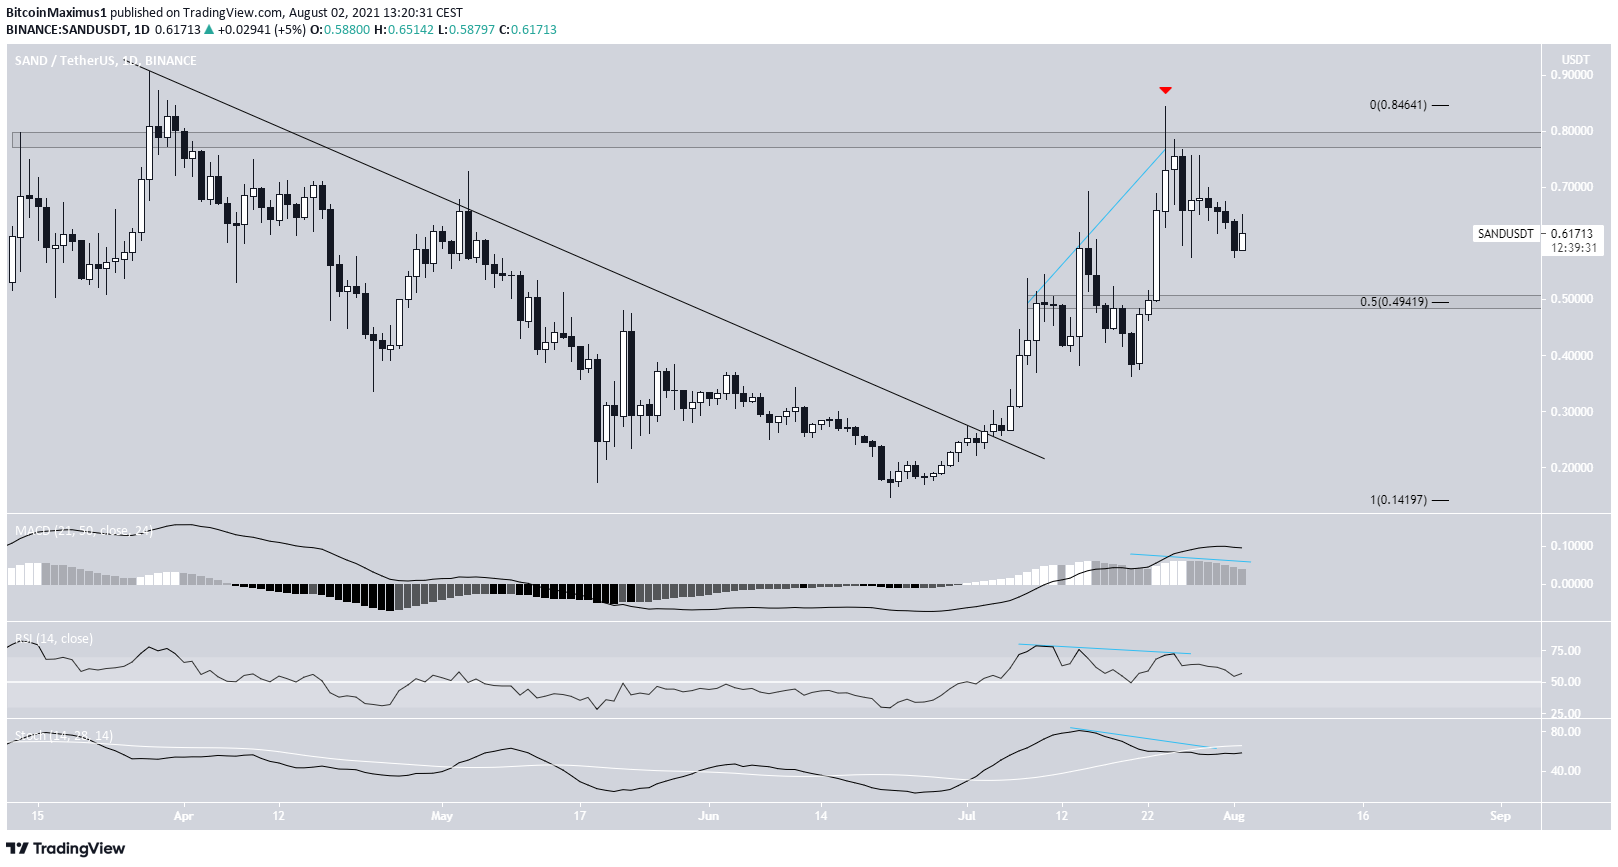
SAND has been increasing since June 22, when it was trading at a low of $0.146. Shortly afterwards, it managed to break out from a descending resistance line and increased at an accelerated rate.
The upward movement continued until July 24, when a high of $0.845 was reached. The high was made just above the $0.78 horizontal resistance area.
However, the higher prices could not be sustained and SAND created a long upper wick (red icon), before falling below the resistance area.
The downward movement was preceded by bearish divergences in the MACD, RSI & Stochastic oscillator.
The closest support area is at $0.495, the 0.5 Fib retracement support level and a horizontal support area.
Highlights
- SAND has broken out from a descending resistance line.
- It is facing resistance at $0.78.