- BTT Token uptrend halted by the resistance of $0.003, price is safeguarded by the 20 EMA on the daily chart
- The press time price of BTT/USDT is $$0.0028 established on the back of a 3.37% decline in the past 24 hours
- BTT price action has broken out of the descending parallel channel on the weekly chart
BTT price staged a recovery on an overall of 64% following the comeback trail from July lows. The massive jump enabled the token to catch hold of the 20 EMA as a reliable support cushion. In the run to challenge the 50 EMA, the price trend of the token was absorbed by the consolidation pit.
The formation of Gravestone Doji in yesterday’s session candlestick marked the termination of the uptrend. Gravestone Doji, being a bearish reversal candlestick, BTT price is heading towards the re-testing the support of the 20 EMA. A decisive close below the support of the $0.0027 will confirm the bearish outlook and project a reversal of a minimal 8%, granted that the price trend is guarded by the support of the 20 EMA.
BTT Token is not out of the woods yet
While the overall price action remains restricted by a massive descending trend line, the BTT token’s uptrend is presently collapsing. The opposition from the resistance of $0.003 remains intact as evidenced by the 7-day accumulation pit.
The flattening of the daily stochastic RSI defeats the odds of a continuation in the upward trajectory. That being said, the price action will most likely continue to remain confined inside the clutches of the resistance trend line.
On the off chance that the BTT price will give a decisive close above the $0.0027, the above accumulation will be disclosed as a halt in the uptrend. The occurrence of this scenario will contradict the bearish outlook and head towards challenging the 200 EMA.
BTT token re-strained by the support trend line on the 4-hour chart
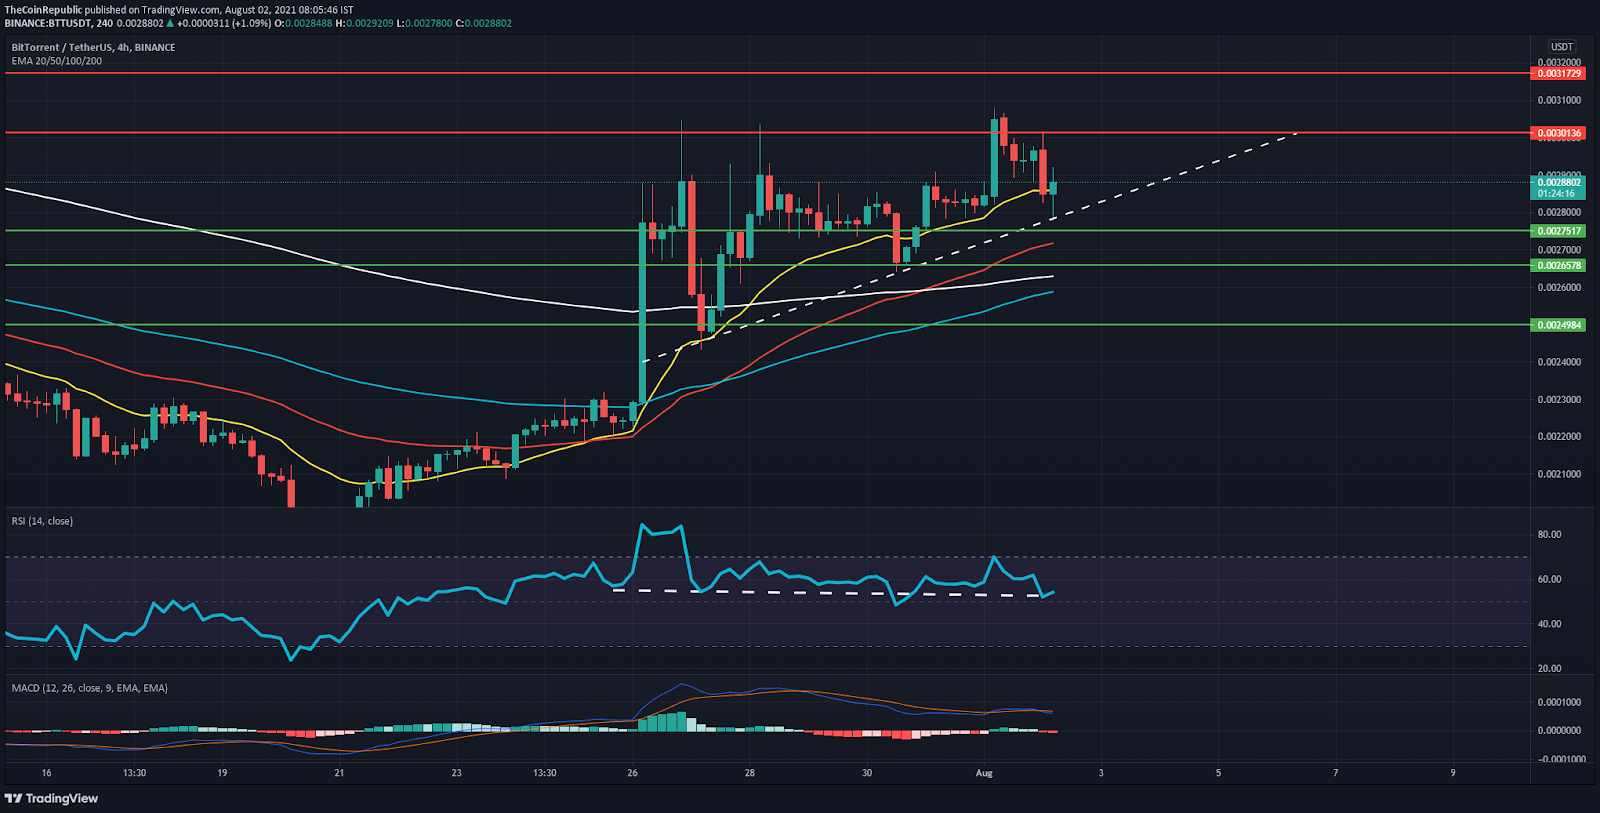
A dive into the 4-hour chart of BTT Token highlights the fact that the price action on this time frame is a completely different scenario. Being confined inside the ascending triangle pattern has enabled the token to record a swing high of $0.0030 in yesterday’s intraday session.
However, the price has temporarily lost the support of the 20 EMA, thus adding credence to the bearish outlook. The continuation of the bearish trend will expose the critical EMAs as reliable support cushions.
Investors should refrain from taking short positions until the price action breaks down from the support trend line.
The Relative Strength Index is sustaining above the equilibrium zone since the enormous candlestick of July 23rd. A break below the range of 50 will be accompanied by the prevalence of the bears.
The Moving Average Convergence Divergence has transpired a bearish crossover in today’s intraday session as demonstrated by the declining histogram inside the negative territory.
SUPPORT : $0.0027, $0.0026
RESISTANCE : $0.0030, $0.0031