The Sandbox (SAND) & FLOW (FLOW) have broken out from a long-term descending resistance line.
Audius (AUDIO) has reclaimed the $0.87 horizontal support area.
All three of these Non-Fungible tokens (NFT) have shown potential to resume their upward movements towards their closest resistances.
SAND
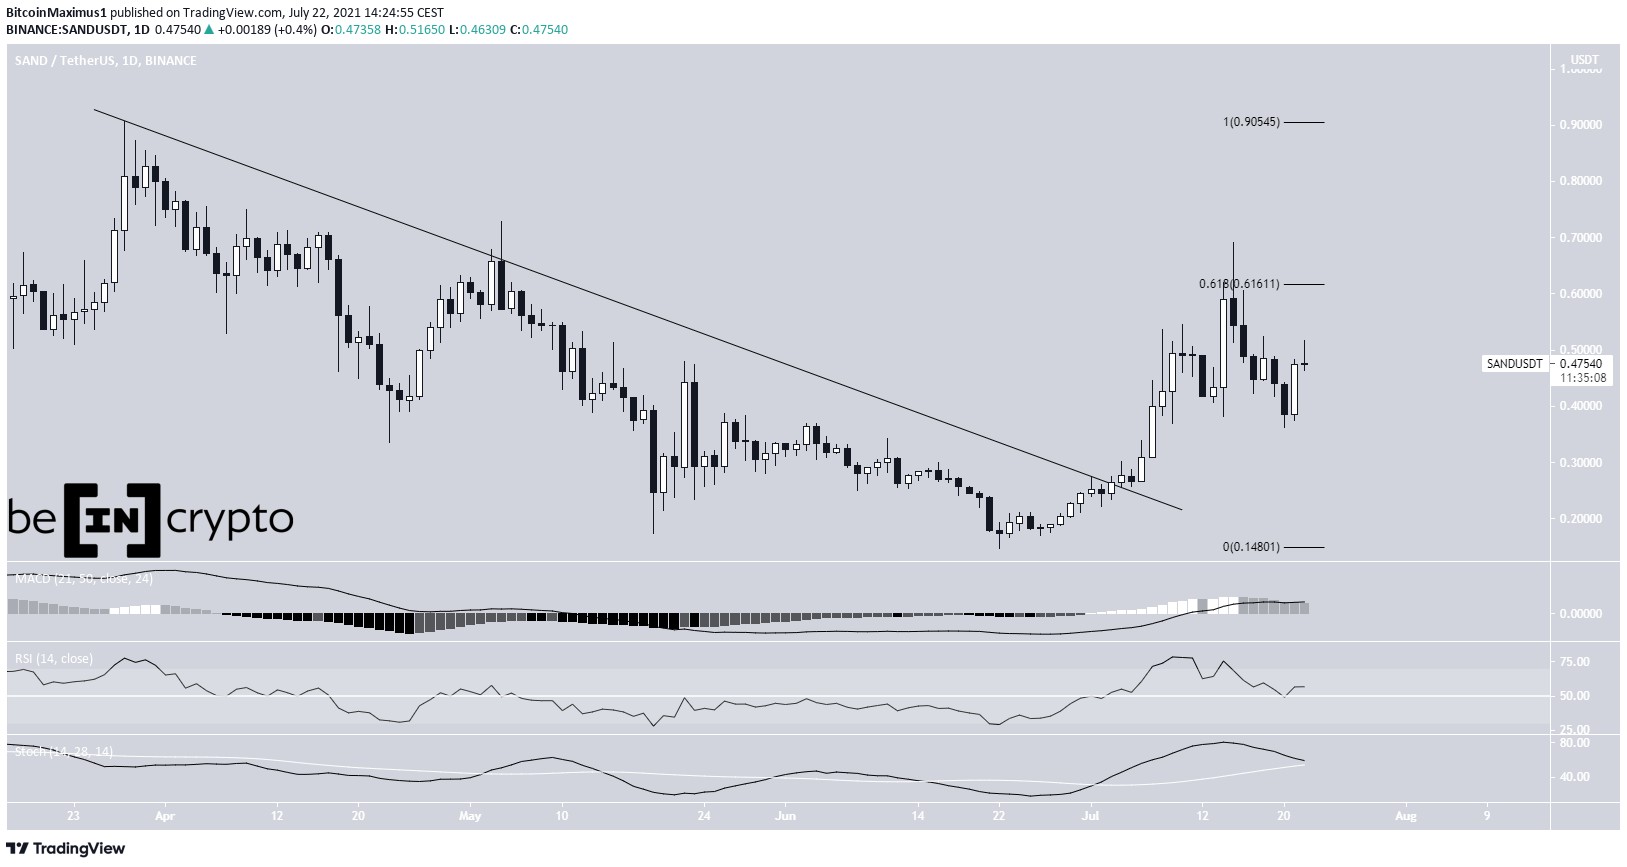
SAND has been decreasing alongside a descending resistance line since March 27. On July 3, it managed to break out above this line and proceeded to reach a high of $0.692 on July 17. The high was made just above the 0.618 Fib retracement resistance level.
However, SAND could not sustain the upward movement and decreased, after creating a long upper wick.
Despite the drop, technical indicators are still bullish. The RSI is above 0 and the MACD is above 0. While the Stochastic oscillator is moving upwards, it has not made a bearish cross yet.
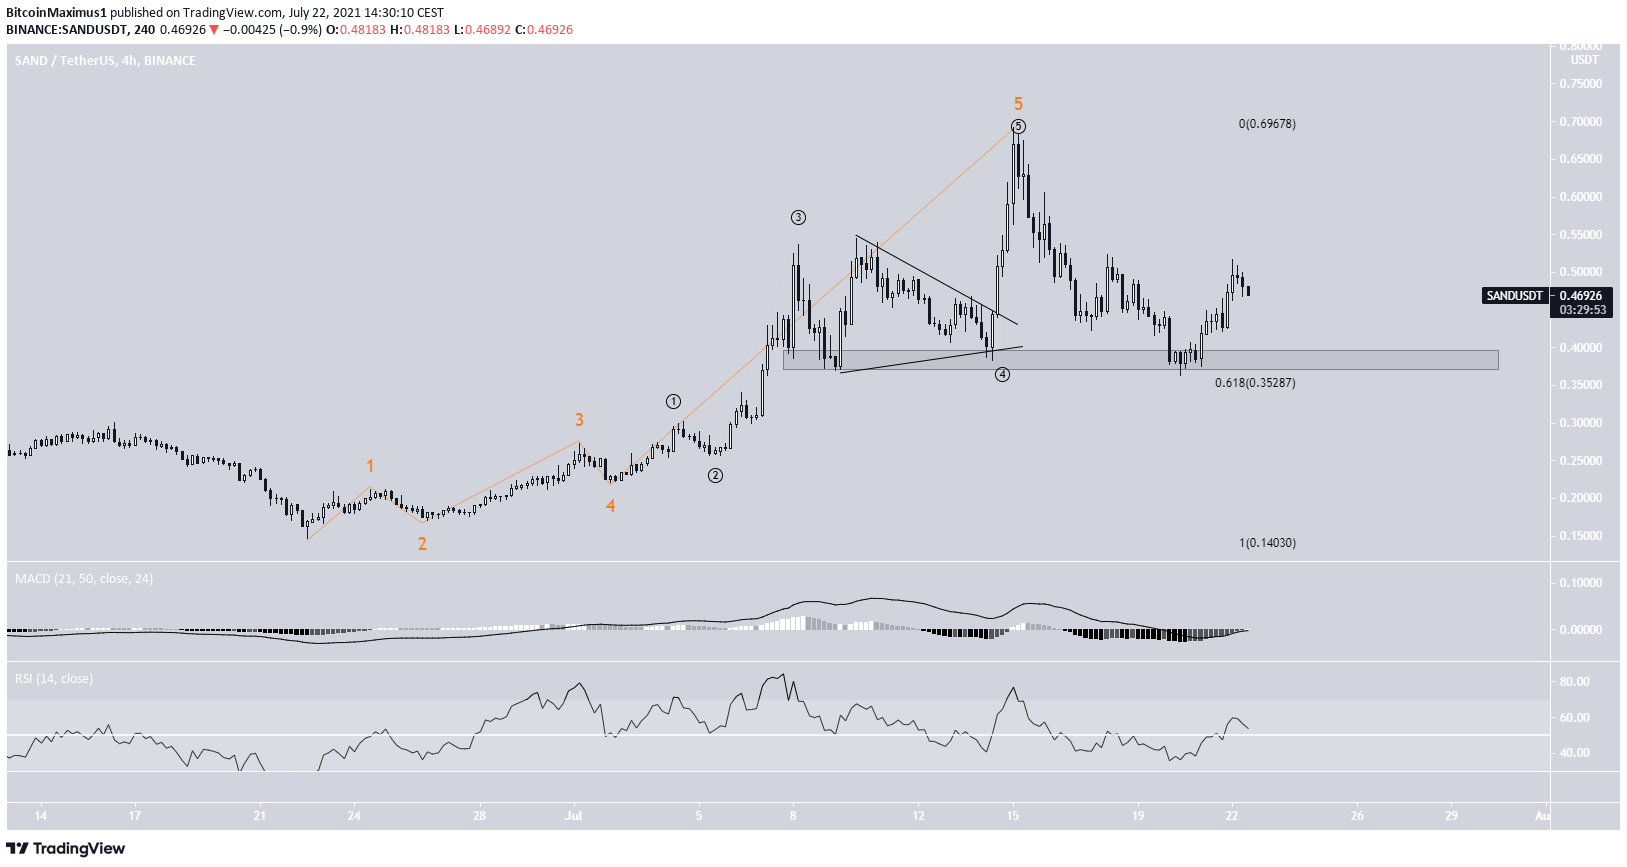
The shorter-term 4-hour chart shows that the token has already completed a five wave bullish structure (orange), which had an extended fifth wave (black).
Afterwards, it retraced all the way to the $0.35-$0.38 support area before bouncing. The support is created by the 0.618 Fib retracement support level and a horizontal support area.
In order for the upward movement to continue, SAND has to hold above the $0.35-$0.38 support area. If successful, it is likely to break out from the 0.618 Fib retracement resistance level at $0.61 and potentially move towards $0.90.
Highlights
- SAND broke out from a descending resistance line.
- Short-term indicators are bullish.
FLOW
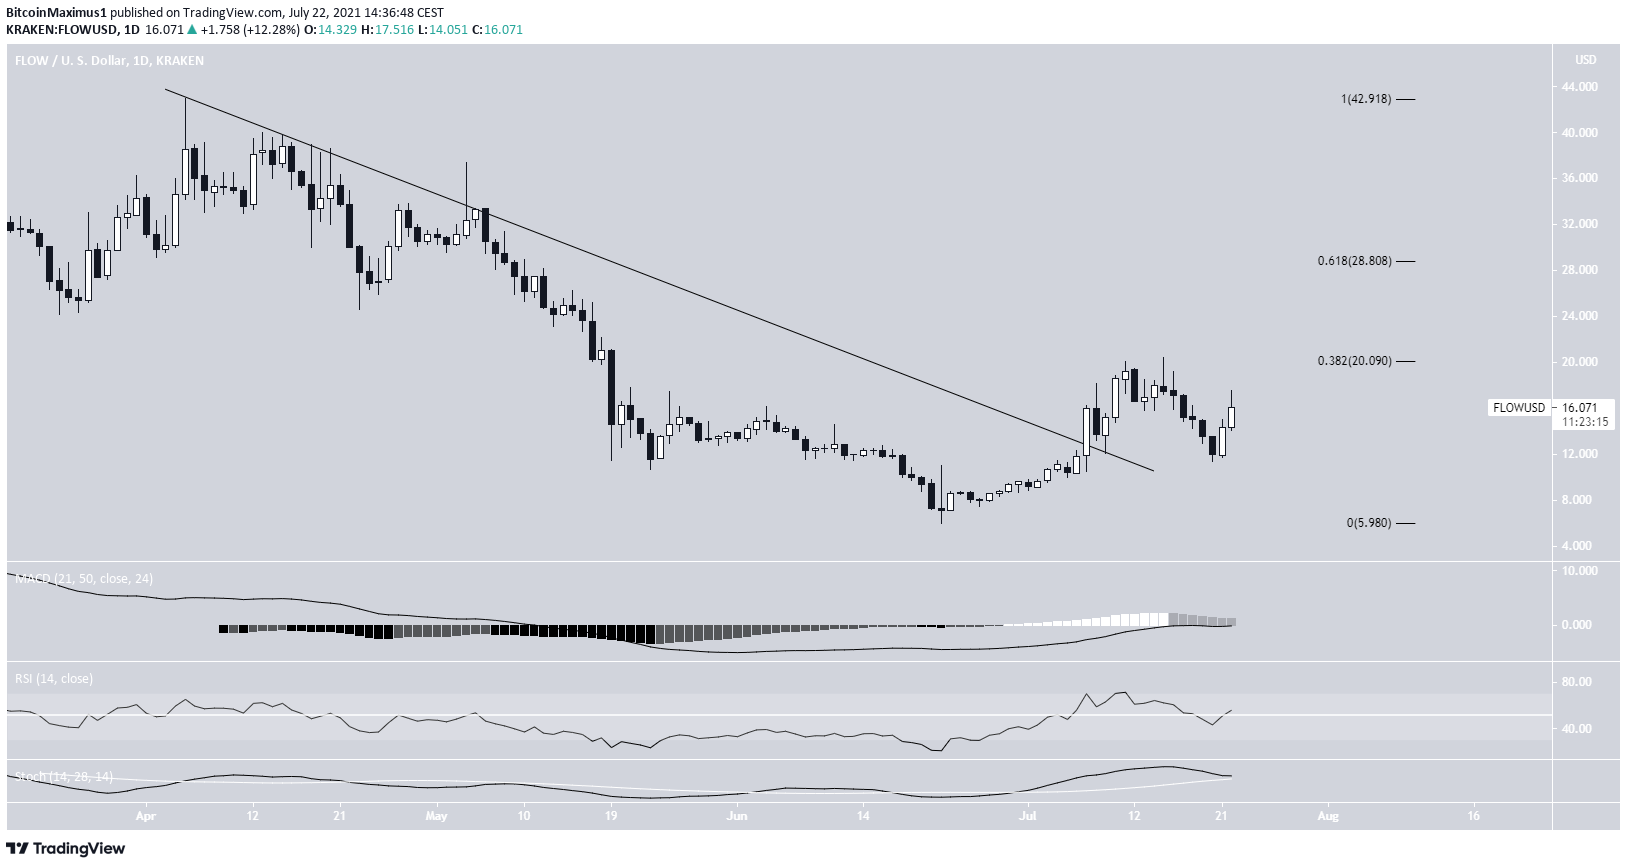
FLOW has been increasing since reaching a low of $6.01 on June 22. On July 7, it broke out from a descending resistance line that had been in place since April.
The token continued to increase until it was rejected by the 0.382 Fib retracement resistance level at $20.
Despite the drop, technical indicators are still relatively bullish, since the MACD is positive and the RSI is above 50.
The next resistance is the 0.618 Fib retracement resistance level at $20.80.
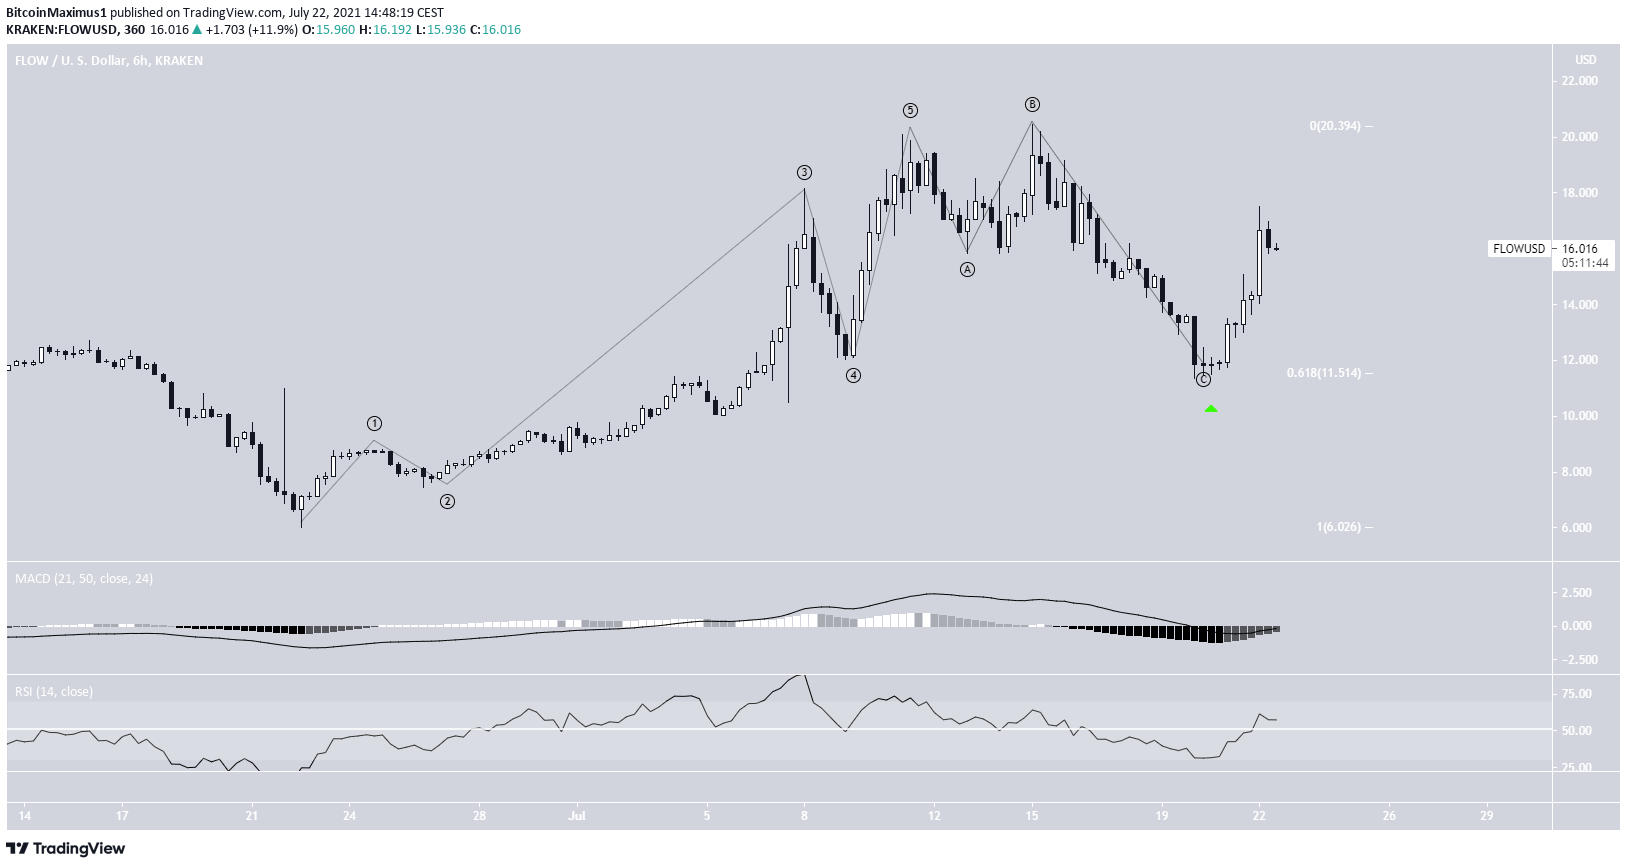
The shorter-term six-hour chart shows a completed bullish impulse and ensuing A-B-C corrective structure (black).
The drop ended as soon as SAND reached the 0.618 Fib retracement support level at $11.51. The token has been moving upwards since.
The MACD & RSI are both increasing, supporting the continuation of the upward movement.
Therefore, it is possible that FLOW will make another attempt at breaking out above $20 and possibly increase towards $28.80.
Highlights
- FLOW has broken out from a descending resistance line.
- It is facing resistance at $20 and $28.80
AUDIO
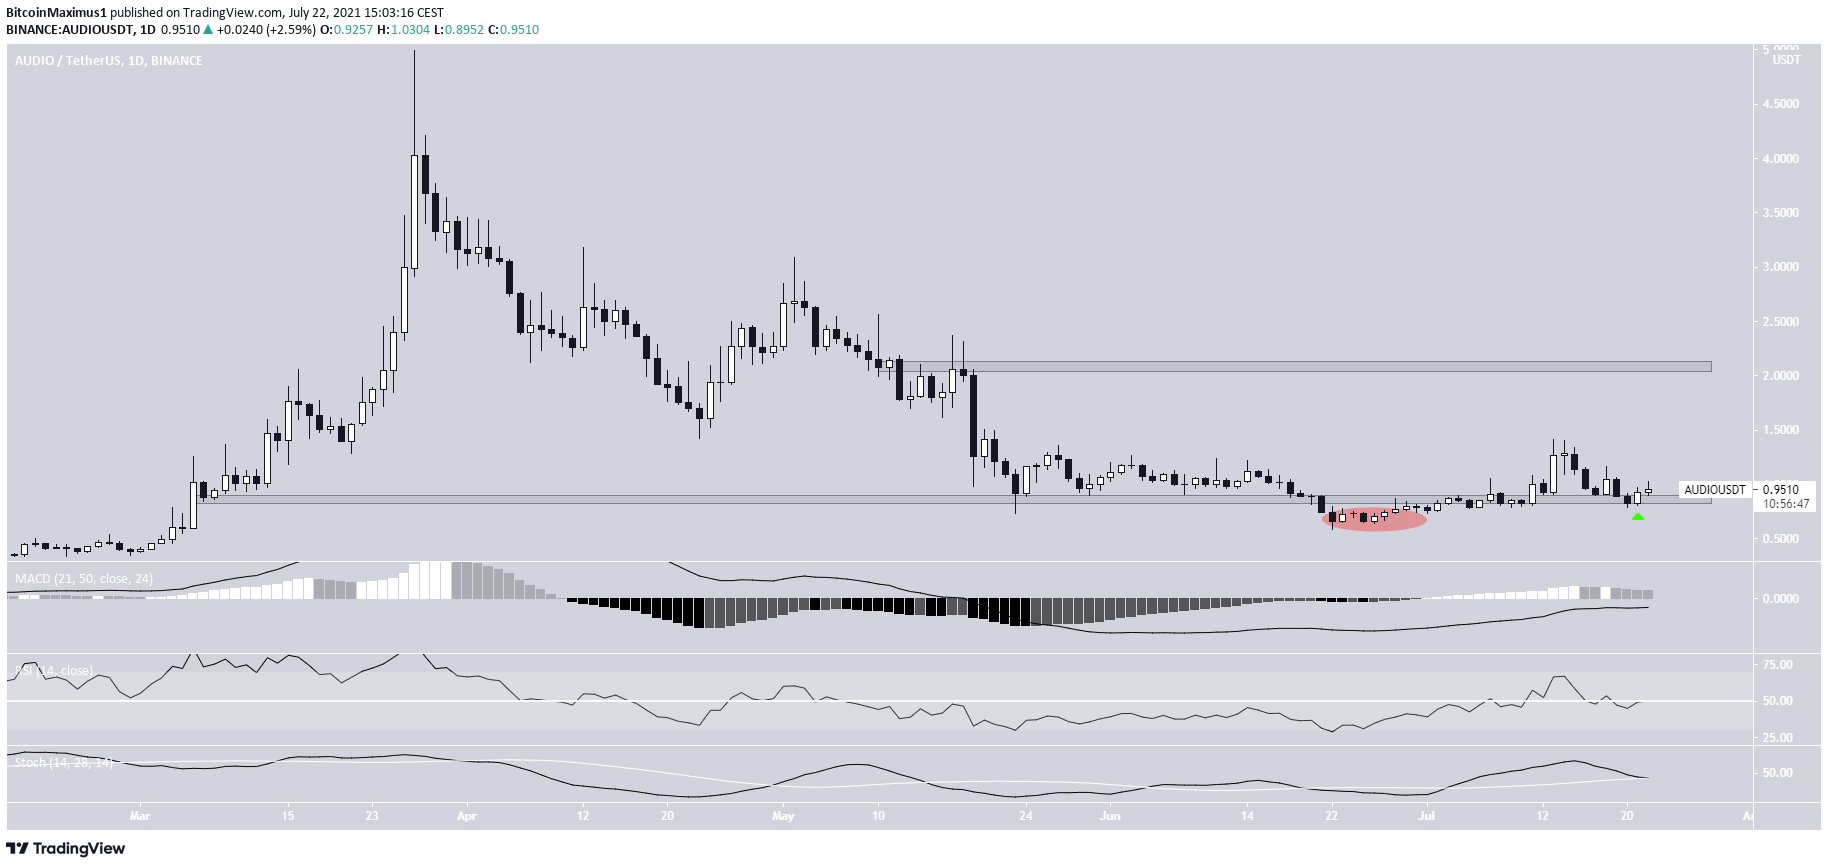
AUDIO has been decreasing since March 27, when it reached an all-time high price of $4.99. The downward movement continued until a low of $0.59 was reached on June 22. This purportedly caused a breakdown from the $0.87 horizontal support area (red icon).
However, the token reclaimed the level shortly afterwards and has now validated it as support (green icon). If the upward movement continues, the closest resistance area would be at $2.05.
However, technical indicators are relatively neutral. The RSI is at the 50 line and the MACD is just below the 0 line. In addition, the Stochastic oscillator is moving downwards, even if it has not yet made a bearish cross.
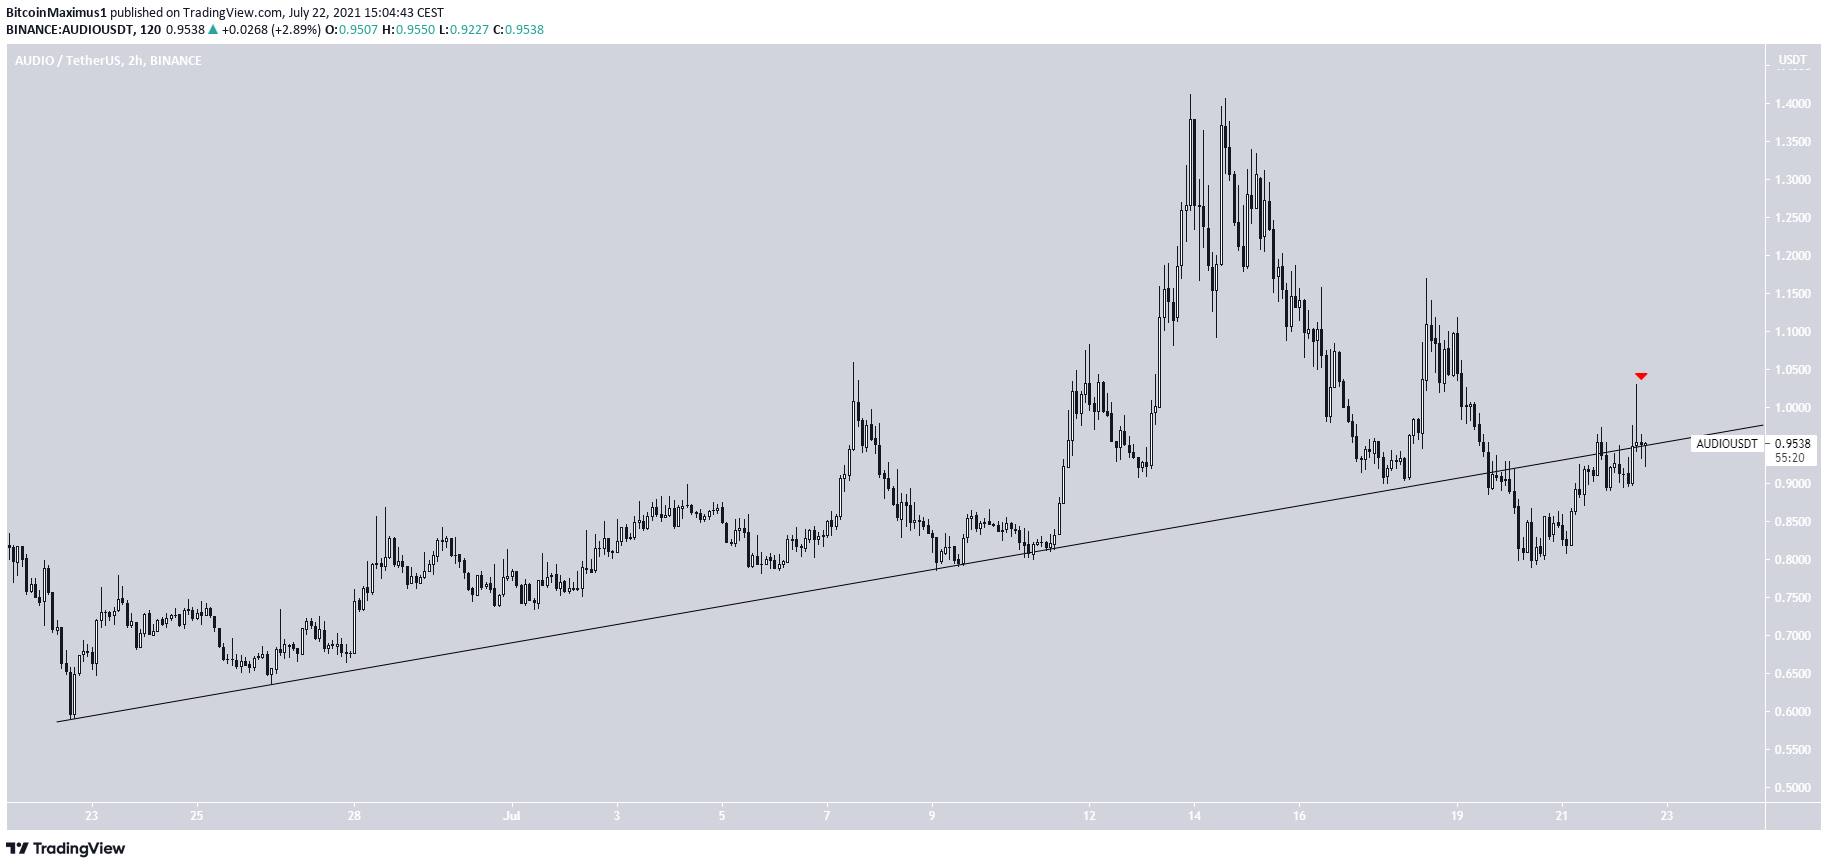
The shorter-term two-hour chart shows that AUDIO has broken down from an ascending support line and is currently validating it as resistance.
In order for the short-term trend to be considered bullish, the token has to reclaim this line.
Highlights
- AUDIO has reclaimed the $0.87 support area.
- It has broken down from an ascending support line.