Digibyte is an innovative blockchain project that facilitates the development of smart contracts, decentralized apps, and digital assets. It is a high-speed tamper-proof network. It is also considered the longest and most decentralized ecosystem. DGB is the in-house token of this ecosystem. Let us look at the technical analysis of DGB.
Past Performance
On Jul 15, 2021, DGB opened at $0.039. On Jul 21, 2021, DGB closed at $0.034. Thus, in the past week, the DGB price has decreased by roughly 15%. In the last 24 hours, DGB has traded between $0.034-$0.037.
https://s3.tradingview.com/snapshots/r/REobZMY7.png
Day-Ahead and Tomorrow
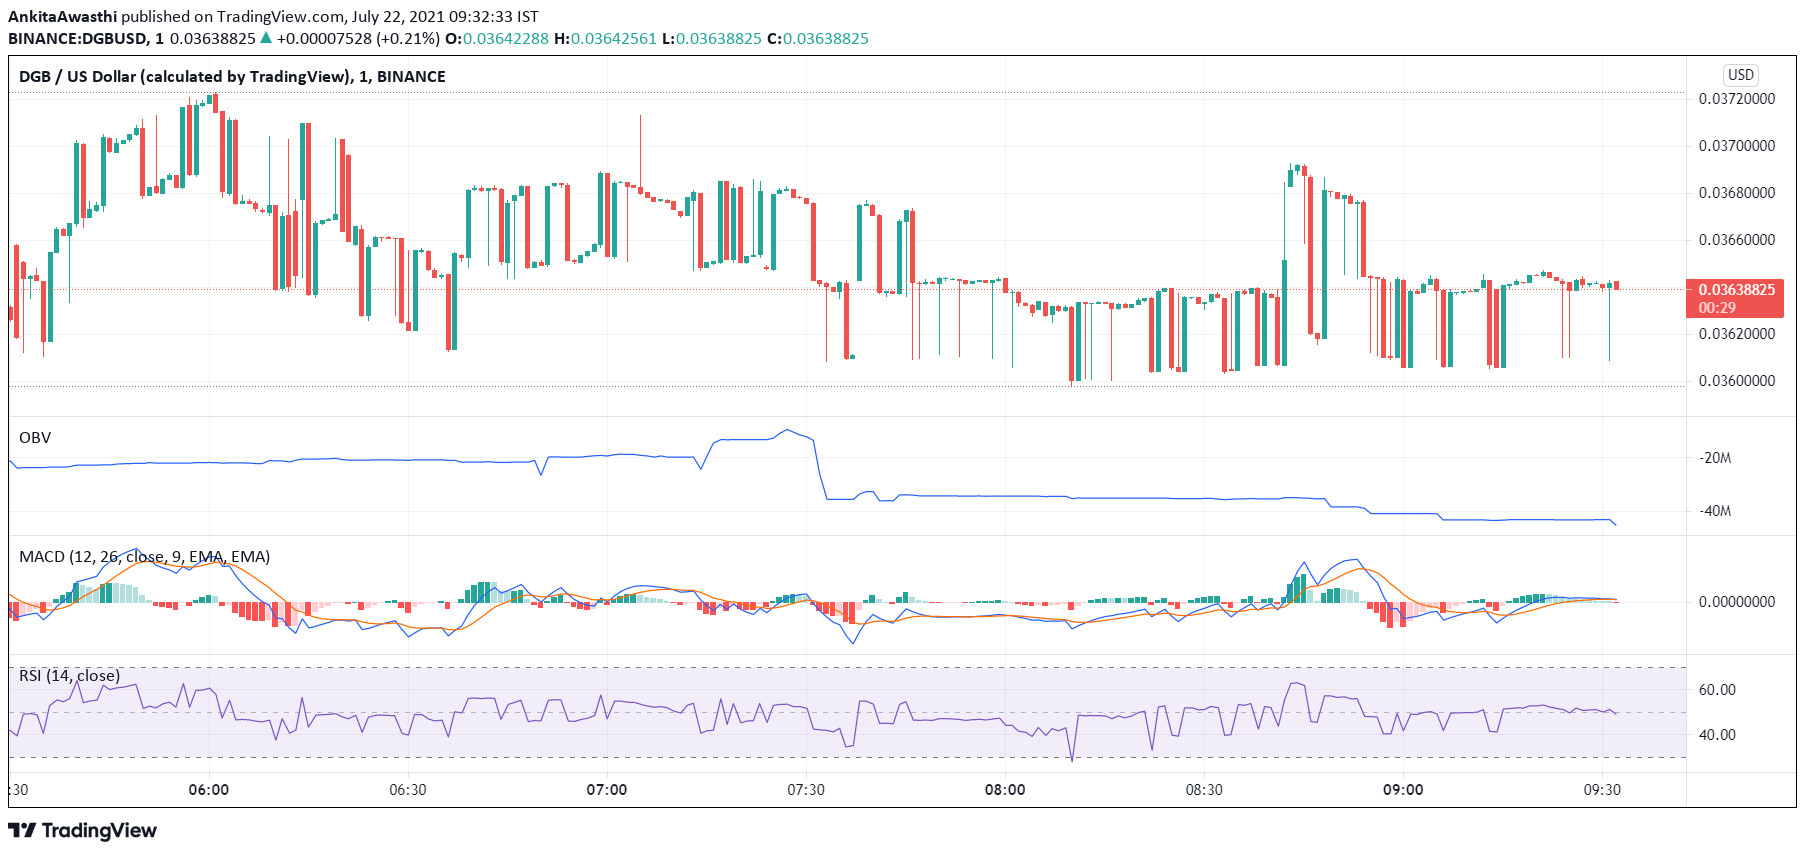
Currently, DGB is trading at $0.036. The price has increased from the day’s opening price of $0.034. Thus, the market seems bullish.
The MACD and signal lines are positive. Thus, the overall market momentum is bullish. However, a bearish crossover by the MACD line over the signal line has occurred. Hence, we can expect intermittent price pullbacks amidst an overall bullish trend.
Currently, the RSI indicator is at 52%. It faced rejection at 50% and rose to the current level. Hence, buying pressures are high. High buying activity will exert upward pressure on the DGB price.
However, the OBV indicator is downward sloping. Thus, selling volumes are higher than buying volumes. Hence, the price may fall further.
In short, when we look at all three oscillators together, we can say that the overall market momentum is bullish, but intermittent price pullbacks may occur. Moreover, the possibility of a bullish trend reversal cannot be ruled out.
DGB Technical Analysis
Currently, the price is above the first Fibonacci pivot resistance level of $0.036. The price may soon break out of the second and third resistance levels of $0.037 and $0.038, respectively.
Currently, the price is above the 23.6% FIB retracement level of $0.036. It may soon break out of the 23.6% FIB extension level of $0.038. If the price retests and falls below these levels by day end, the bearish trend is probably strong enough to sustain till tomorrow.