- THETA coin shows a death crossover of the 50 and 200-day EMA in the daily time frame
- The THETA/BTC pair was trading at 0.0001348 BTC with a loss of 11.29%
- the 24 trading volume in THETA coin is 266.6 Million
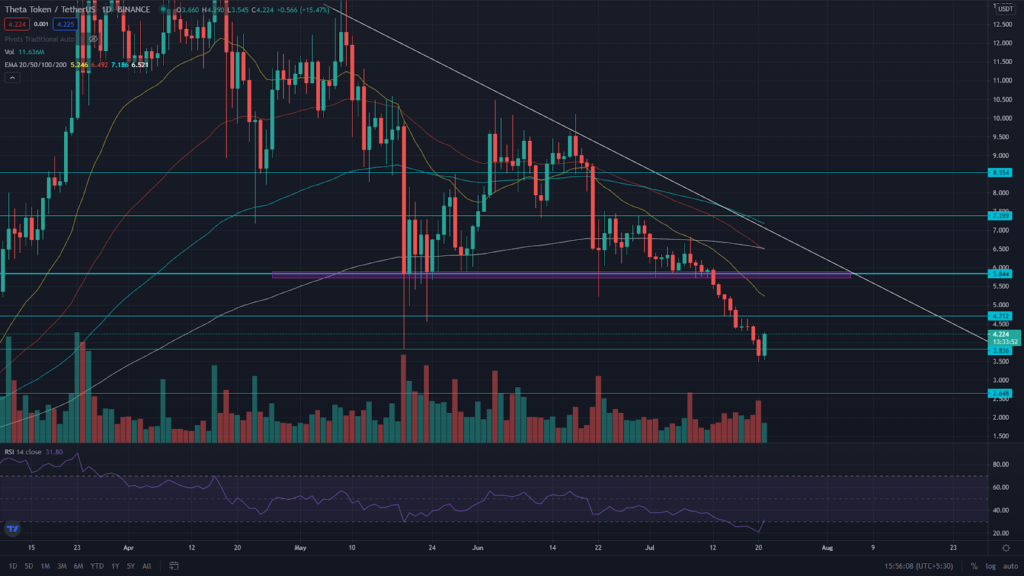
The THETA bears were marching strongly towards lower levels of this coin. Continuing with the bear attack, the price was able to break down from the $3.8 support level, with strong volume supporting it. However, today the price gave a strong bullish engulfing candle pattern and immediately pushed the price right above the broken support. Therefore, the traders must wait patiently as the closing of this candle will decide if the breakdown was a fake breakdown or a genuine one.
About the EMA’s, the THETA coin is trading below all the critical EMA’s 20, 50, 100, and 200, indicating a solid bearish trend formation. In addition, the chart also shows the death crossover of the 50-200 EMA, which could attract more sellers in the coin market.
The RSI (BEARISH) value is at 31, indicating the strong bearish sentiment in the market. However, with just one big green candle, the RSI is back above the overselling zone, revealing some hidden strength present on the bull side.
THETA Coin Price Gives A Breakout From The Descending Trendline.
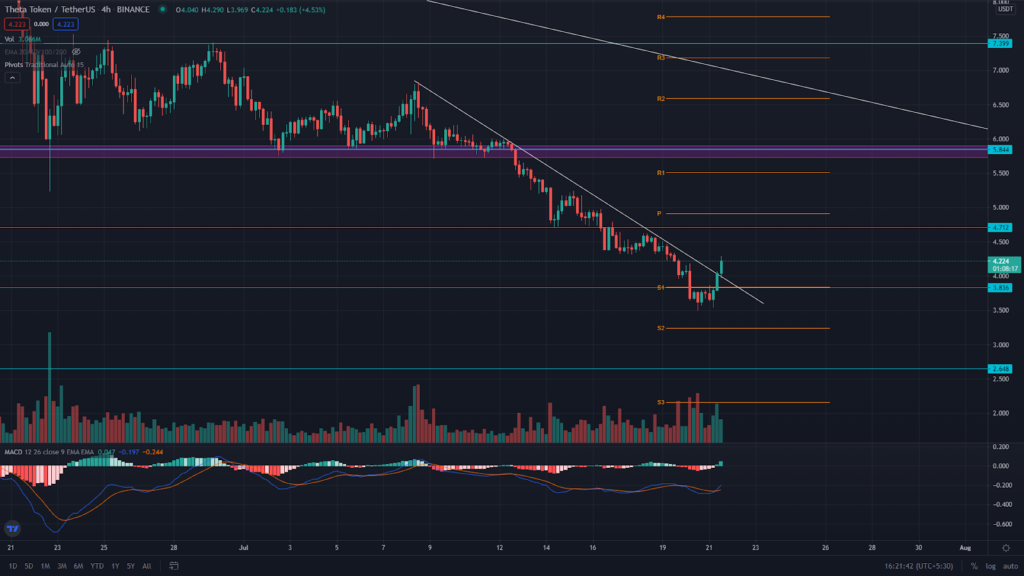
The THETA coin price is finally out of the chains of the descending trendline. This breakout from the trendline would provide a great confirmation if the price manages to sustain above the $3.8 level, offering an excellent long opportunity for THETA traders.
The MACD indicator (BEARISH) shows that both the MACD line and the signal line are moving below the neutral zone(0.00), suggesting the coin is in a bearish position. However, the line has just given a bullish crossover, which could provide an excellent confirmation when the price indicates a reversal.
Conclusion: From the technical perspective, the overall trend in the THETA coin is strongly bearish. And as mentioned above, the price action suggests a fake breakout of the $3.8 support, which would eventually provide excellent long traders to THETA traders if the price manages to sustain above this support level.
Support: $3.8
Resistance: $4.7