- The 24 hours trading volume of the token is 1,384,532,208 and the gain of 7.34% was seen. The live price of CARDANO is $1.06
- The token has shown the pattern of three inside up.
- The RSI oscillator for ADA shows the OVERBOUGHT action.
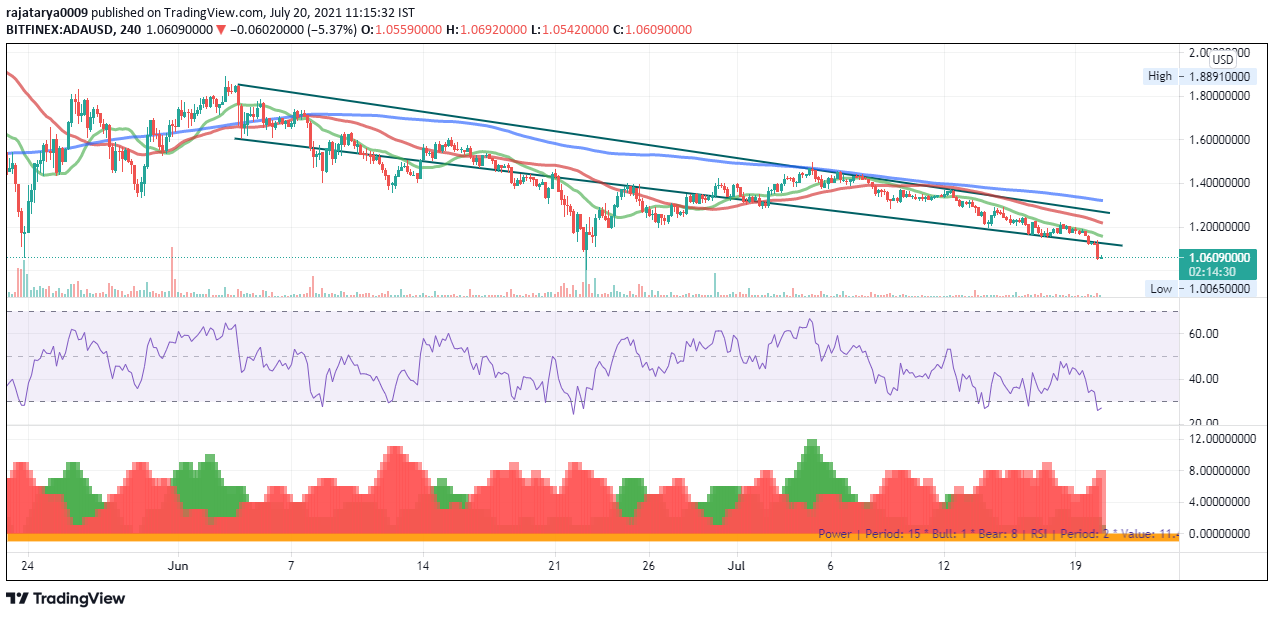
The CARDANO has been running well below its 200 days moving average and also below its 50 days moving average. The chart above shows the movement of the token with respect to SMA-20, SMA-50 and SMA-200. Despite running SMA-20running of SMA-20 below the other two SMA’s the trading volume is increasing. The token was able to touch SMA-200 but could not crosscrossed it. SMA-50 was achievable at times. The trendline marked in the chart shows the movement of SMA-20 above and below SMA-50 in the last 1 month time frame and so the returns were approximately 20-25% in this timeframe.
An RSI oscillator is also present in the chart which shows the proper time to buy or sell the token. RSI for the last 5 hours shows the value of 22.596 and marks the overbought action. MA-5, MA-10 and MA-20 show the sell action as well. However, the CARDANO at present is all set to buy. Which is expected to show a hike in price in the coming time.
The bull/bear power has the value of -0.1542 and shows the sell action. The high/low marks the sell action with the value of -0.0865.
The ADA-BTC pair is trailing at the level of 0.00003575 and the low of 4.08% was seen whereas the ADA-ETH pair is trailing at the level of 0.000606 and the low by 2.60% was seen in the last 24 hours. The token has shown the percentage change by 10.50% since yesterday’s open.
The volume/market cap of the token is 0.04057 and its market dominance is 2.83%.
Conclusion: The days range for the coin is 1.051414 – 1.134108 and presently is at 1.06. The token is expected to show rise in the coming time and so the buying is very much for it. However, at present the token could not sustain the trendline support and the candle’s formation is below it. If you wish to purchase this token then long it as SMA-20 is below SMA-50 and 200.
Technical Instruments:
Pivot: 1.058056
R-1: 1.064036
R-2: 1.067731
S-1: 1.052076
S-2: 1.048381
Note:
- The unit is USD
- SMA-20: Green colour
- SMA-50: Red colour
- SMA-200: Blue colour