- The coin is trading at $385.07 around 1.57%up form the previous level
- The coin is facing resistance from it’s all major EMA
- The coin is trading at 0.01211 BTC around 1.93% up and 0.197 ETH around 1.24% down with respect to ethereum and bitcoin
Compound was founded in 2017 by Robert Leshner and Geoffrey Hayes. Its function is that the investor will earn interest on deposit of their cryptocurrency. The coin has the market capitalization of $3,832,657,426 and the circulating supply of 5,360,409.00 COMP. Cpoi is showing some great movement in the volume which indicates a good volatility in the stock. Last 24hrs volume of the coin is $144,330,407
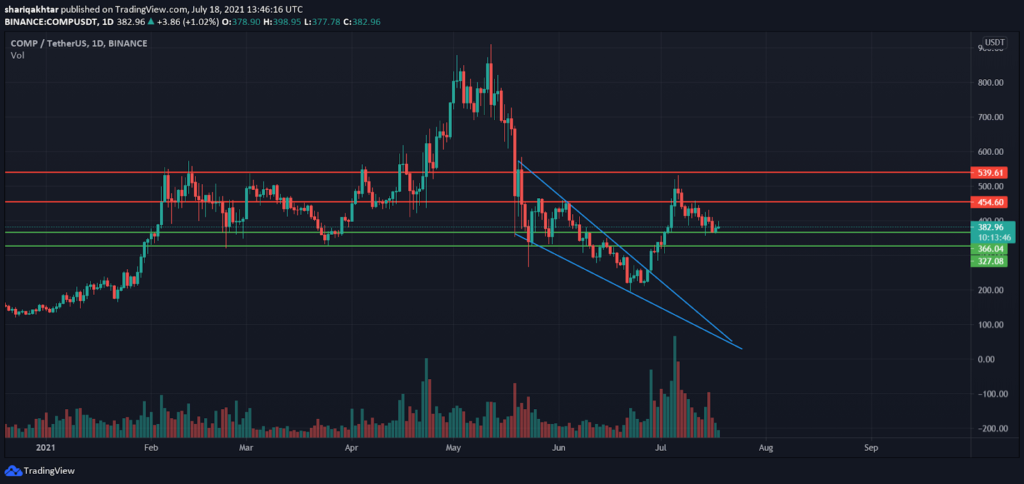
CHART ANALYSIS
On charts we can see that the coin had given the breakout from the descending triangle pattern. After the breakout the coin had started the bull run and faced rejection from the resistance and went to retrace the support. The volume of the coin indicates the starting of bull movement in the coin.
INDICATOR ANALYSIS
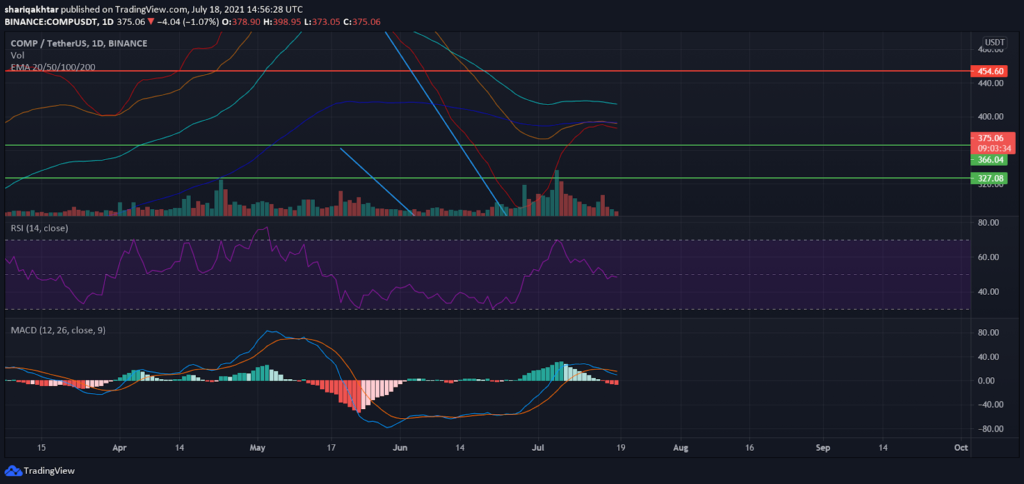
According to the indicator analysis we find out that the coin is trading below its all major exponential moving average and 200 EMA crossing the 50 EMA which shows the formation of the death cross.
RSI is trading at 48.5 after touching its oversold zone. No sign of any divergence in the coin
In MACD we can see that SIGNAL line had crossed the MACD line and rising histogram shows the increasing bearish momentum in the coin
MAJOR SUPPORT AND RESISTANCE FOR THE COIN IS AT
S1= $366.25 AND S2= $ 327.08
R1= $454.60 AND R2= $ 539.61