On its $0.02/3-box reversal Point and Figure chart, Cardano recently broke out above the bear-market angle. Cardano has now entered a bull market as a result of this move. Cardano’s price has shifted to the bulls, but many investors are still waiting for confirmation.
In addition, Cardano’s price action has evolved into a state where traders who use a price action chart rather than a time-based chart like Japanese candlesticks can gain a big edge. Cardano just converted into a bull market by breaching the former bear market trend line on the $0.02/3-box reversal Point and Figure chart on the red diagonal line.
Traders who primarily utilize Japanese candlestick charts are more likely to enter long trades on the Cardano price too soon and towards the top of a swing. A downturn after transitioning from a bull market to a bear market and vice versa is common in Point and Figure Analysis. At this point, a potential trade setup can now be executed.
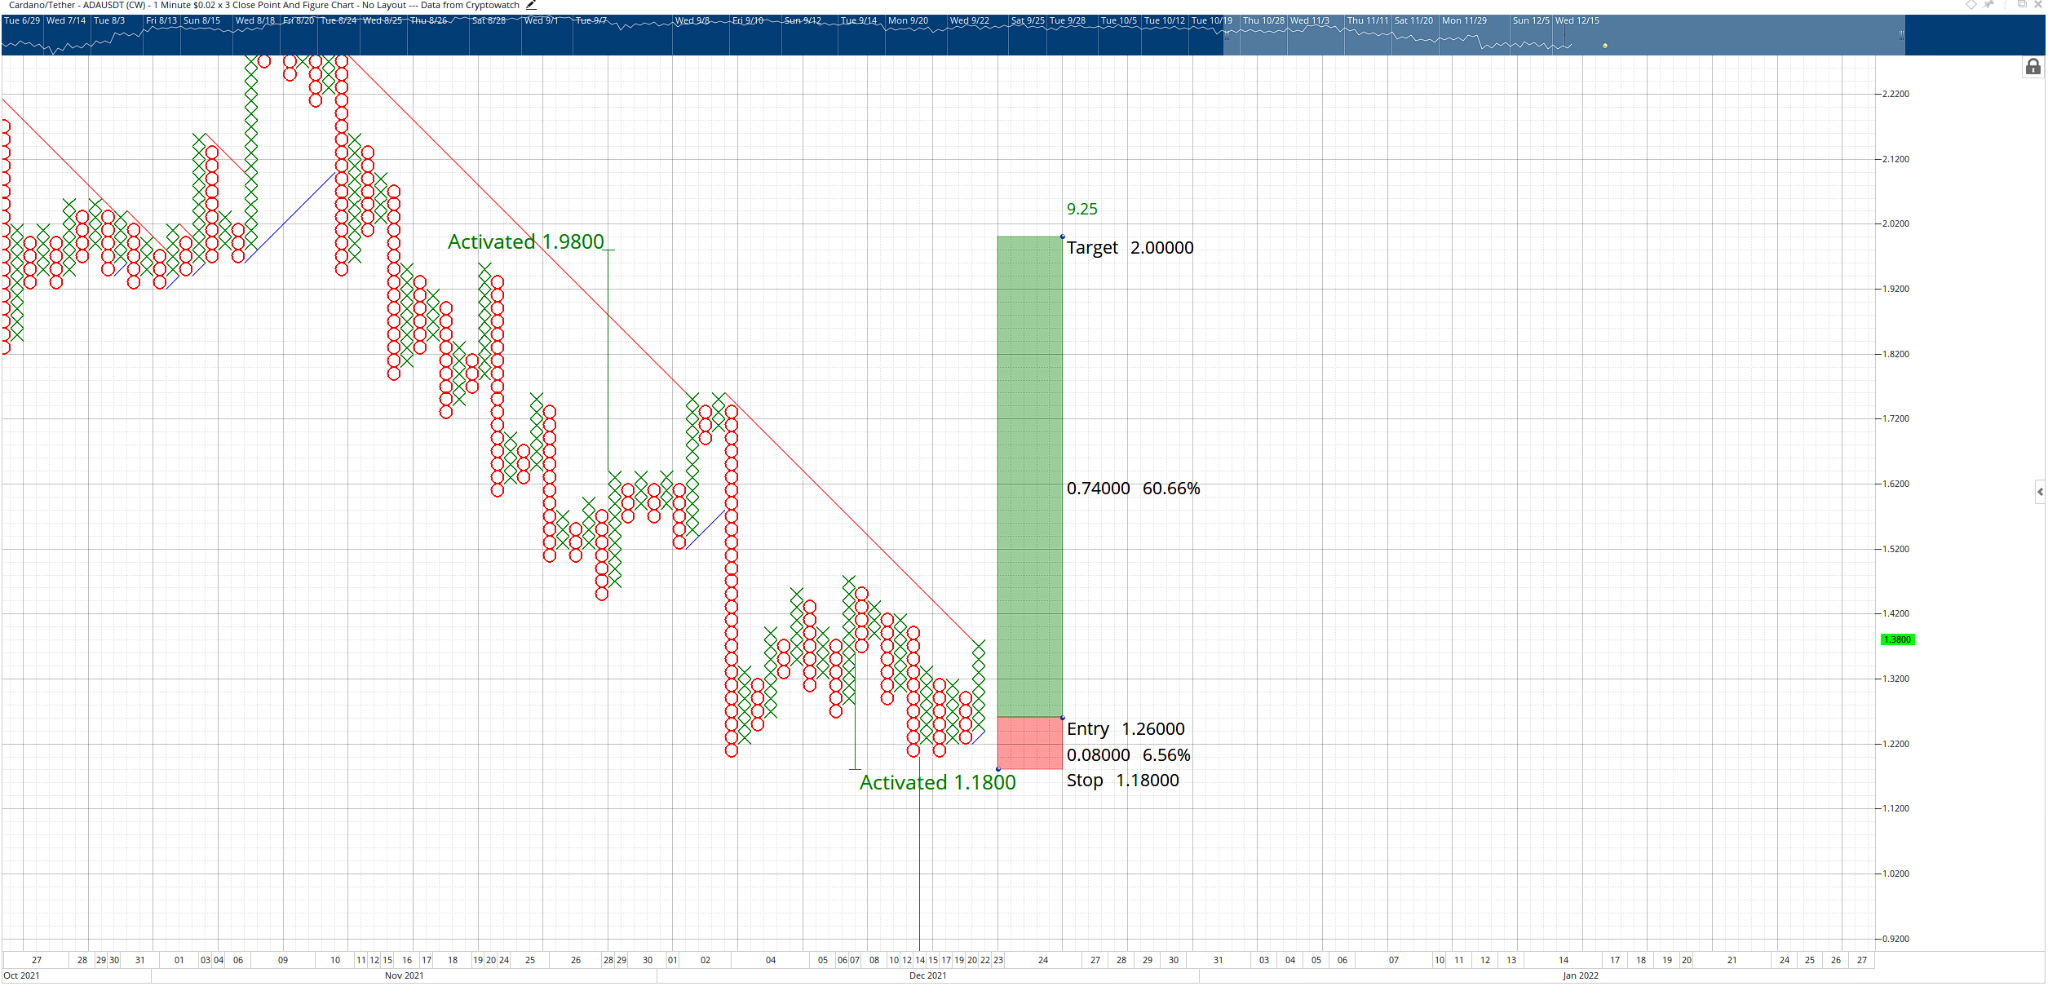
A buy limit order between $1.32 and $1.26, a stop loss at $1.18, and a profit objective of $2.00 is the potential long trade for Cardano price. Depending on the entrance, this trade has a reward-to-risk ratio of 4.86:1 to 9.25:1. A three-box trailing stop would protect you from any inferred profit after you enter the market.
If Cardano closes at or below the $1.18 value region, the deal is voided. In that case, the $1.00 level becomes precarious and may collapse. In that case, Cardano might fall as low as $0.40. At press time, ADA is up 6.23% and trades at $1.43 according to CoinMarketCap.