Bulls could not hold the gained initiative for a long time, and most of the coins are again in the red zone.
ETH/USD
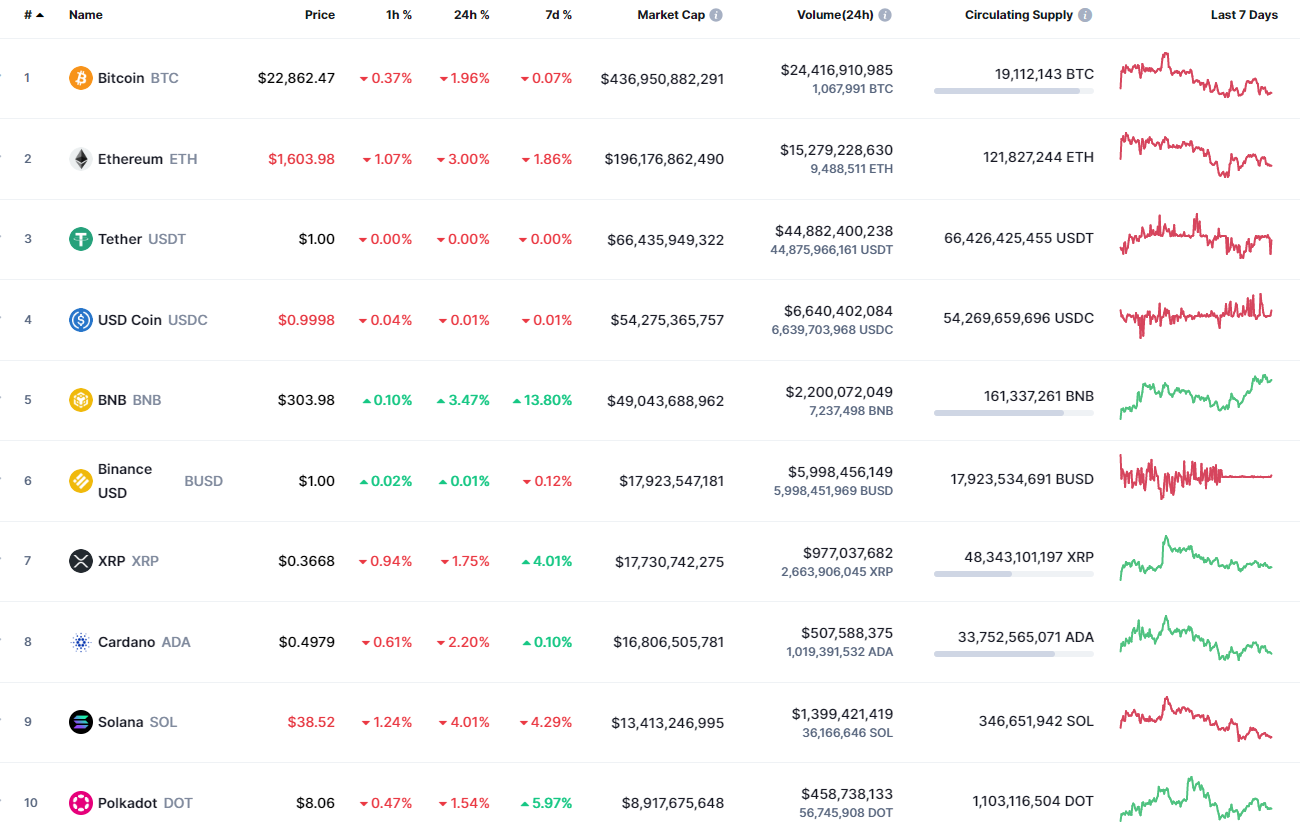
Ethereum (ETH) has followed the fall of Bitcoin (BTC), going down by 2.79%.
ETH/USD chart by TradingView" src="https://cnews24.ru/uploads/dd1/dd12d18f34e2b10cd0476473ae0867b2d8d794d7.png" size="1818x857">
On the daily chart, Ethereum (ETH) has continued yesterday's fall against the declining volume. At the moment, the price is approaching the $1,600 mark, the breakout of which may lead to the test of the interim local level at $1,550. Such a scenario is relevant until the end of the week.
ETH/USD chart by TradingView" src="https://cnews24.ru/uploads/eb3/eb3267eb3ce827eb17ec545514177683594748f4.png" size="1818x857">
On the weekly time frame, the leading altcoin might not have accumulated enough power for the midterm bull run. A continued rise is possible only if the price returns to the resistance level at $1,785.
ETH/USD chart by TradingView" src="https://cnews24.ru/uploads/ed6/ed6bb64f95440d9d695c766e3e8d73d8c03cc873.png" size="1818x857">
From the local point of view, Ethereum (ETH) has made a false breakout of the level at $1,634. If the candle closes below the $1,607 mark, one can expect a sharp drop to $1,580 soon.
Ethereum is trading at $1,608 at press time.