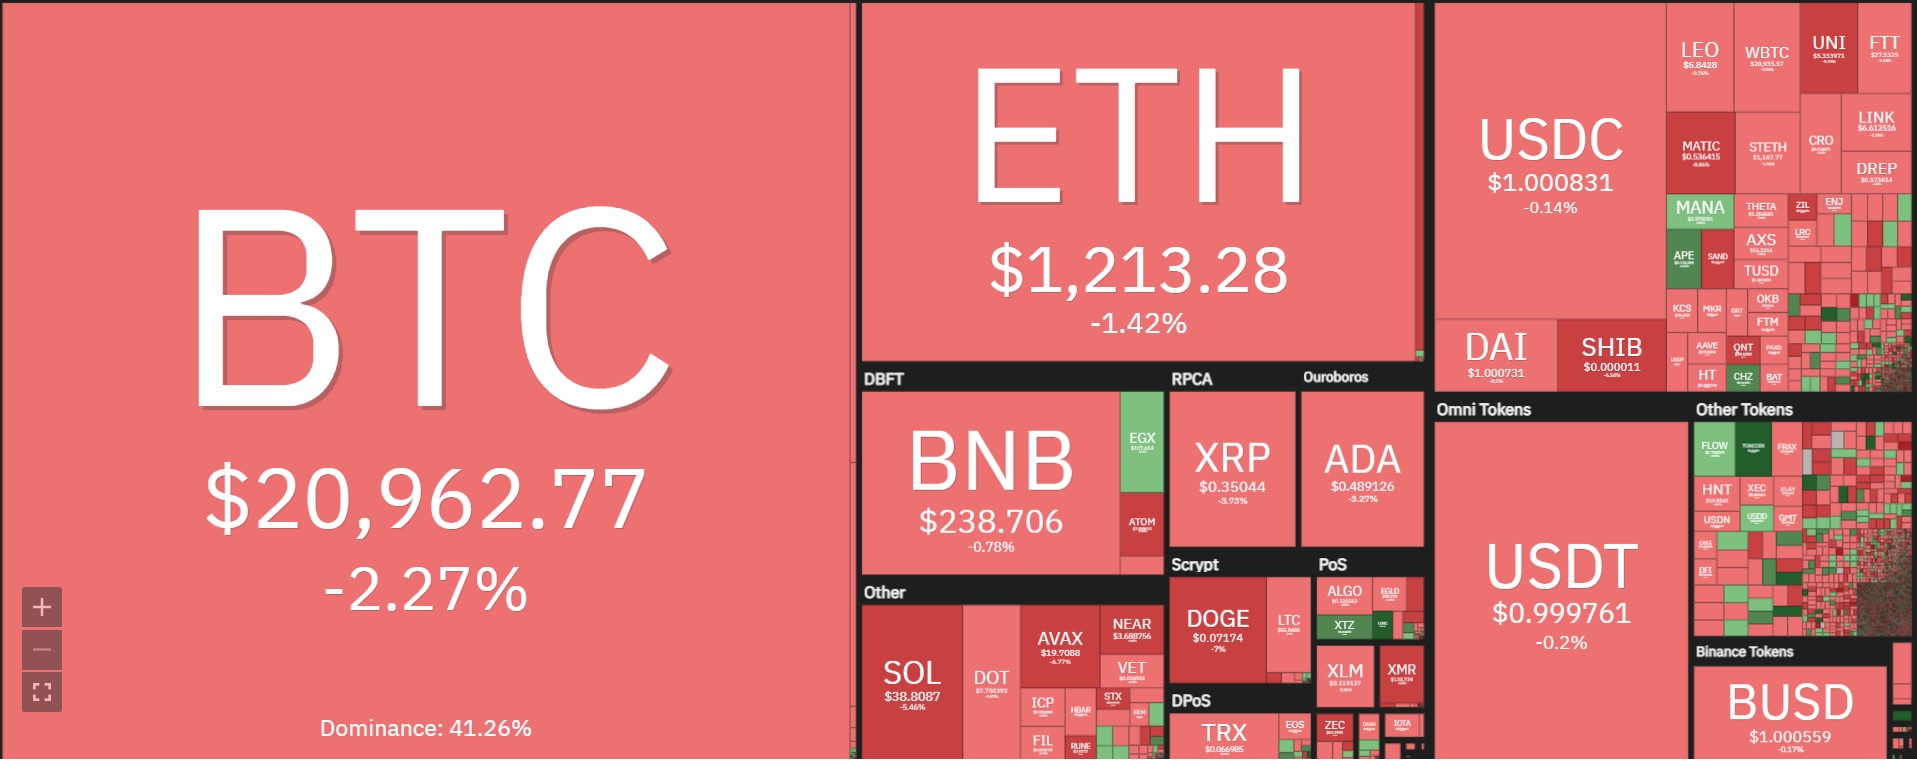
Ethereum price analysis shows that more buyers are willing to consolidate their positions near $1,000 support zone. The hourly timeframes show low volumes but the price is not dropping below $1,100 despite repeated attempts by the bears. The ETH/USD pair has performed relatively well compared to the BTC/USD pair considering the current bloodbath in the crypto industry.
So, is the worst over for Ethereum? As the crypto market recovers from massive losses, the traders are re-evaluating their positions as per longer time frames. Ethereum price analysis shows that the pair has outperformed more altcoins in terms of price stability. The bulls have been able to keep the price above $1,000 despite the shocks affecting the industry.
The macro factors including the global crypto regulations and the Federal Reserve interest rate dilemma has put crypto in a tight spot. Ethereum charts show a relatively calm demeanour which can spark some buying frenzy among the traders ultimately pushing the price above $1,300.
Ethereum price analysis for the last 24 hours: Technical indicators suggest minor upmove
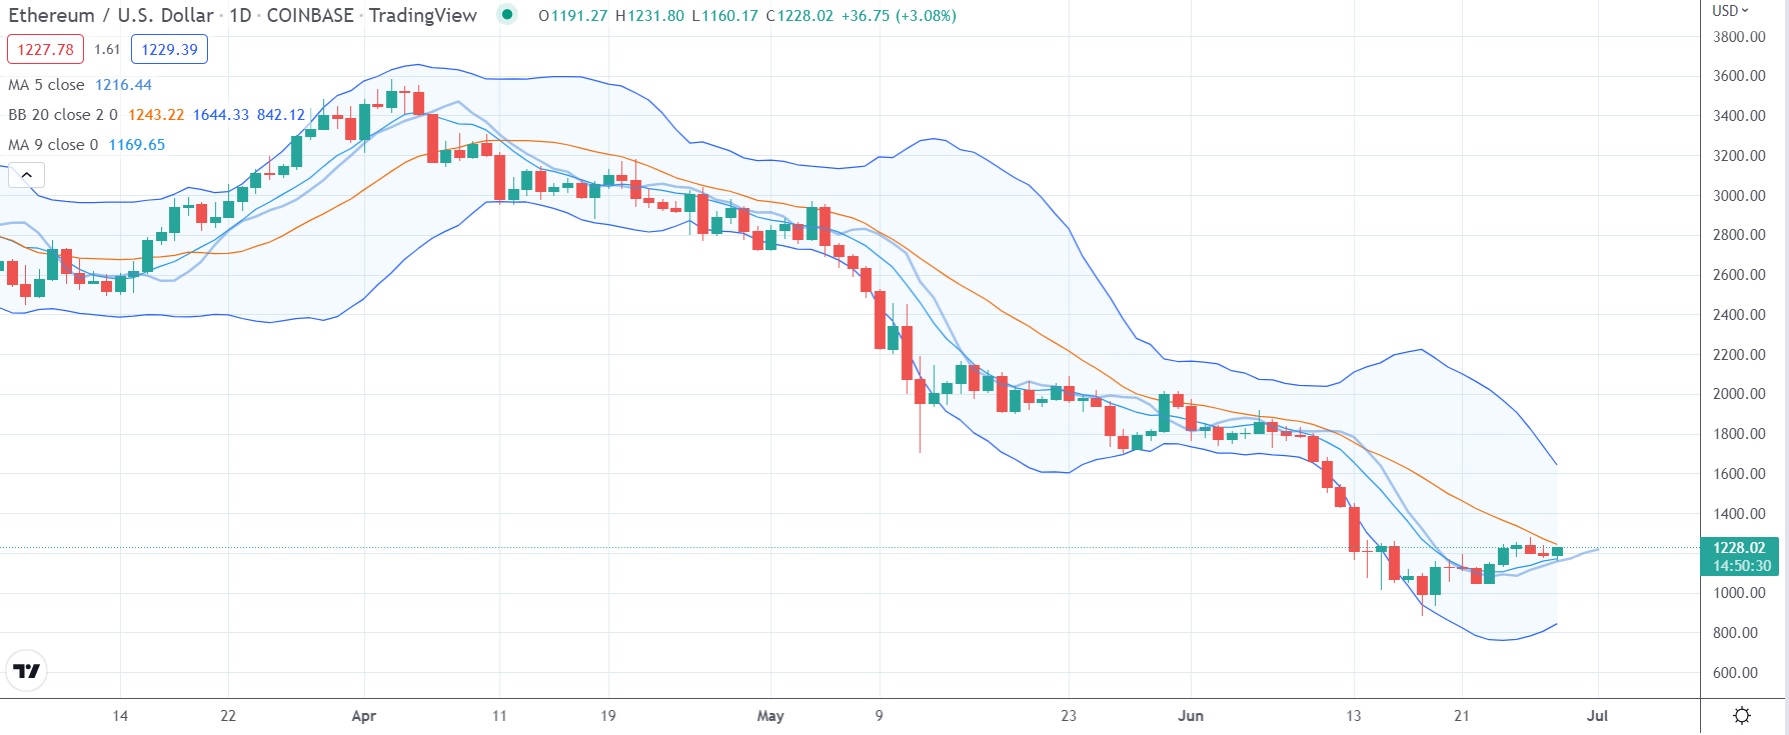
The ETH/USD daily price movements show that the pair is well supported near $1,000. The resistance at $1,300 beckons the buyers but with a hint of caution. The larger timeframe charts also show potential selling targets, including $1,350 and $1,450, where sellers can become active. ETH recovery on the hourly charts can spark minor buying interest but the bulls need to be cautious about technical indicators which show long-term weakness in the ETH/USD pair.
The bulls may seem like in control in the short term, the overall bearish sentiment in the crypto market is surely going to hurt the positive sentiment. Day traders can expect make some profits with careful scalping but the overall picture is red with small upmoves. The contracting Bollinger Bands also show that the price is going to be stagnating for a while before making any strong move in either direction.
ETH/USD 4-hour chart: Sideways price action limits day-trader interest
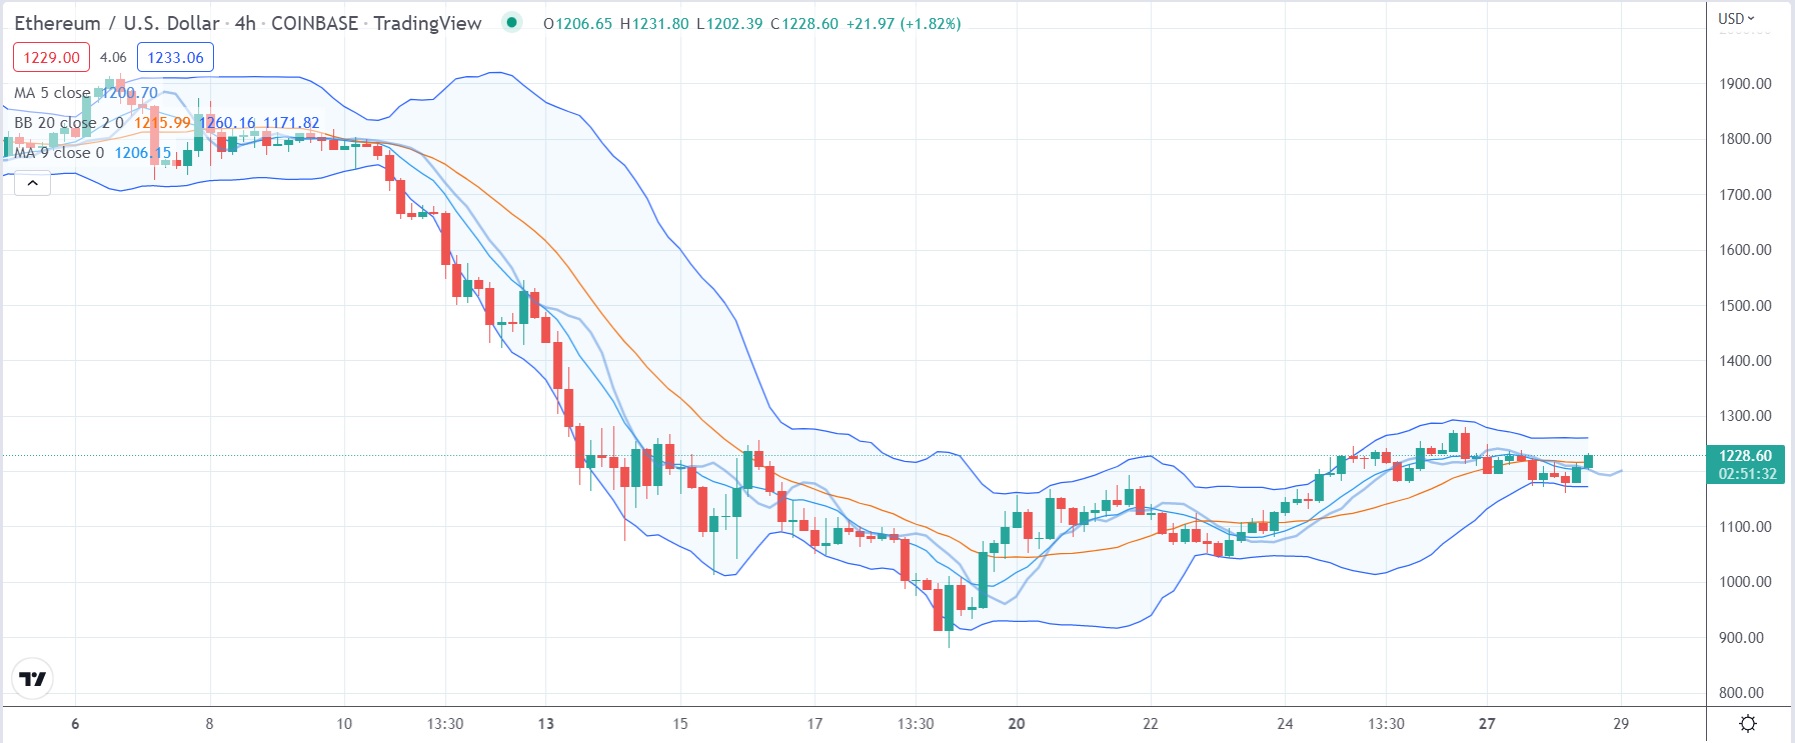
The muted movement on the hourly charts shows that the Ethereum price remains stagnant. The price is moving sideways and strictly within the Bollinger Bands. The macro factors are not going to be act as a catalyst anytime soon. The daily trading volume shows below average interest amongst the traders which means bulls should not start accumulating anytime soon.
Furthermore, the RSI technical indicator at 35 shows negative bias in the charts. However, seller exhaustion will not kick in till the price touches $1,000 level. The 20-day moving average at $1,335 is pushing the price lower and acting as the first barrier against any significant price rise. According to the Ethereum price analysis, the MACD indicator does not show any cross-over which further limits any strong upside move.
Ethereum price analysis conclusion: ETH bulls look for a definite sign to buy
A slew of technical indicators suggest that there is no definite silver lining on the ETH charts. The 50-day moving average at $1,734 limits the price movement on the daily charts. Ethereum price analysis shows that the bulls will try to move in a sideways fashion as long as they can to keep the price stable over a longer time period. However, any sharp rise in the price is only going to spark a selling frenzy.
Ethereum price analysis shows any sharp reversal in the price will only embolden bulls to place large sell orders. Bulls must observe $1,350 price in order to get clear signals from the market.
Disclaimer. The information provided is not trading advice. Cryptopolitan.com holds no liability for any investments made based on the information provided on this page. We strongly recommend independent research and/or consultation with a qualified professional before making any investment decisions.