- After recording the latest 52-week low of $896, the Ethereum coin saw a sharp jump.
- ETH price reached above the 20 EMA and retests the 50 EMA as resistance in the context of the 4-hours price chart.
- The Ethereum coin belonging to the bitcoin pair is down a little over 1.9% at 0.05439 satoshis.
After a long struggle the big whales finally entered the market, as a result, most of the cryptocurrencies fell into the green zone after a scary bloodbath. Ethereum price also sharply reversed its ongoing trend from recent lows as Bitcoin recovered above $20K this week.
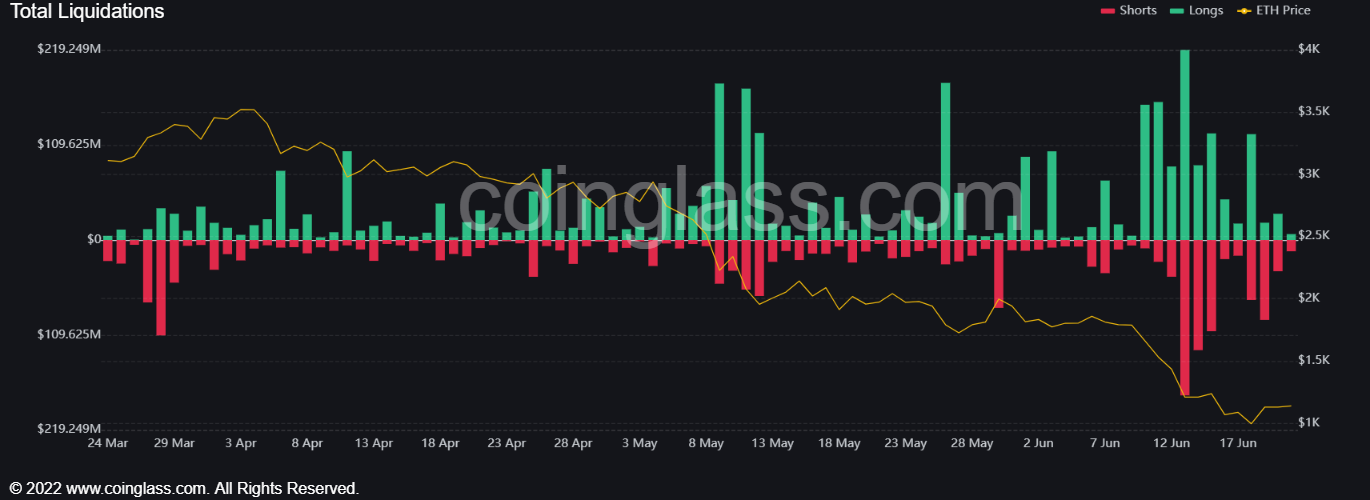
According to data from Coin Glass, around $77.7 million has been liquidated due to the huge volatility in the market over the past 24 hours. This shows that speculators are still not sure about the confirmation of the directional trend.
Amid bullish momentum, the market cap of the Ethereum coin has soared to an all-time high of $138 billion in the past 5 days, according to data from the last 24 hours of CMC.
ETH on 4-hours chart
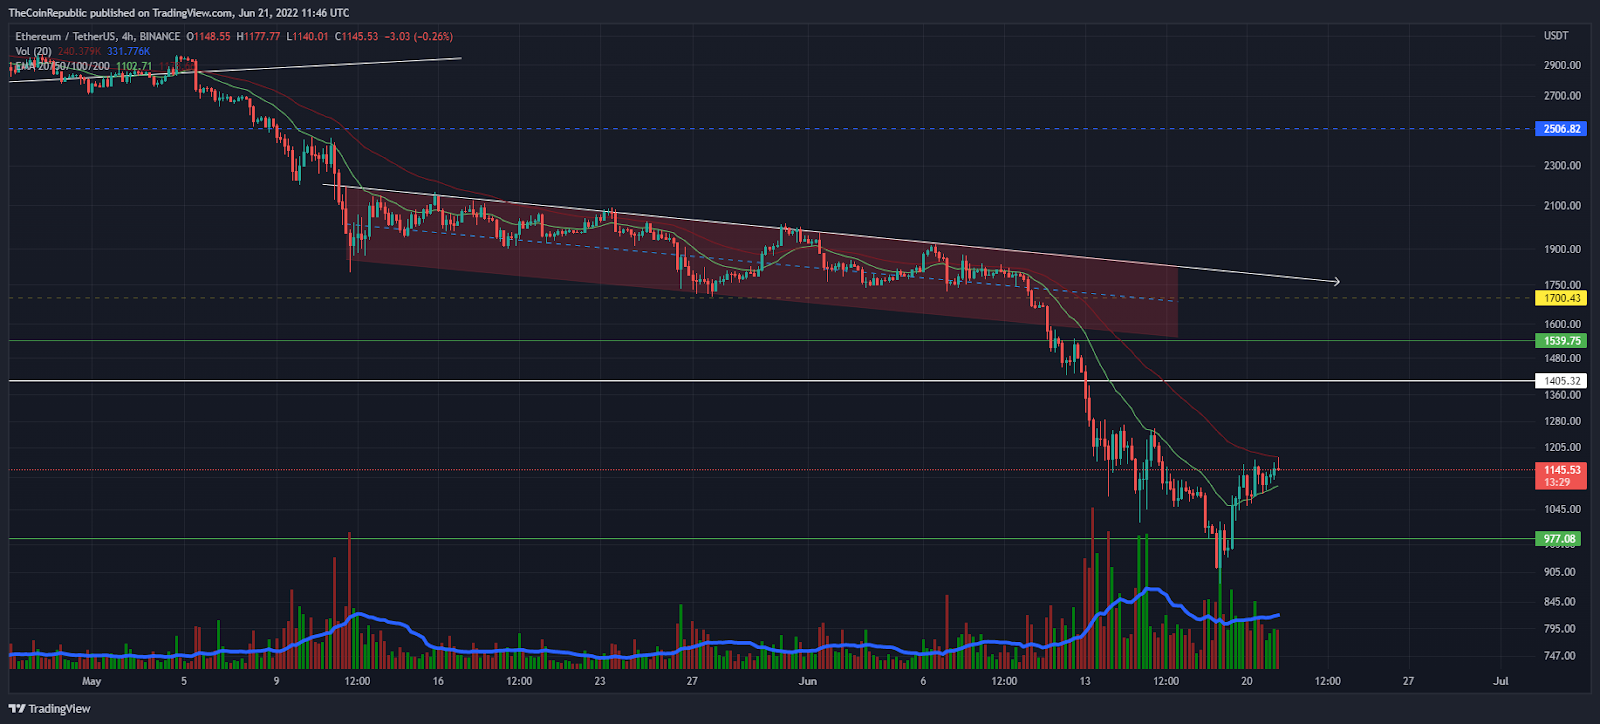
ETH price has started an upside correction above the $1000 conceptual round level which has now turned into a hedge zone for buyers if it turns out from the current levels.
The price of ETH has fluctuated widely over the past 10 days, but as BTC manages $20K as support, ETH bulls are anticipating higher momentum above the current levels.
Meanwhile, the Ethereum coin is trading at $1,145 at the time of writing. Thus, the weekly price candle shows a 1.6% rally so far.
The Ethereum coin belonging to the bitcoin pair is down 1.9% at 0.05439 satoshis. But ETH price traded lower above the 20 EMA against the USDT pair and retested the 50 EMA as resistance in the context of the 4-hours price chart.
Parabolic SAR started to drive down the price of Ethereum
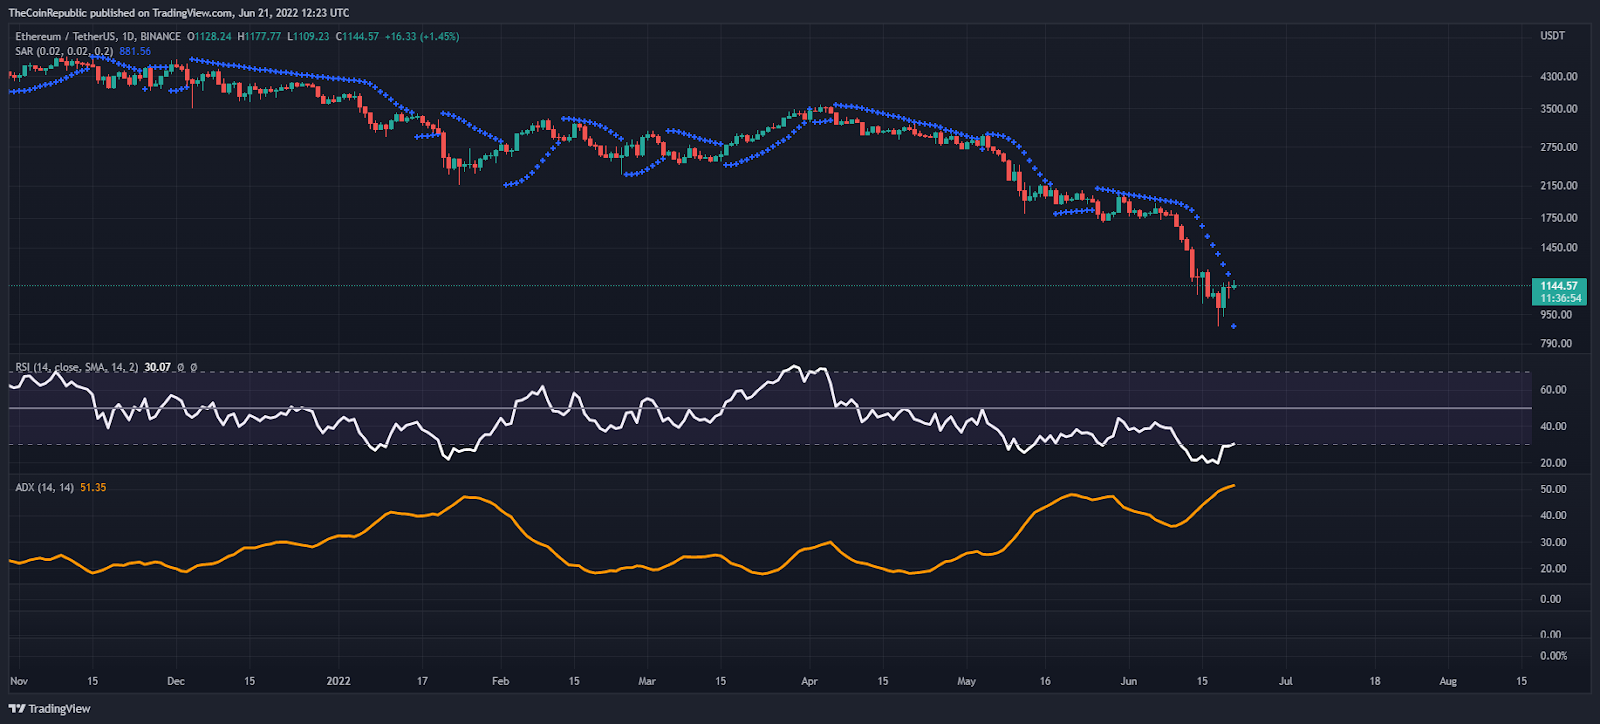
On the daily price chart, the Parabolic SAR indicator is starting to move lower below the current price of ETH, indicating an upcoming bullish move, but the opposite resistance area for Ethereum bulls is near the $1250 to $1280 area.
The daily RSI is correcting from the overbought zone. There may be trouble near the half-line.
Moreover, ADX is still rising higher and is managing the 50 mark, showing strength in ETH’s bullish move.
Conclusion
Although the hourly price action is showing higher-highs formation, the daily price chart shows a slightly sideways trend. After all, bullish price action exists.
Support level – $869 and $1000
Resistance level – $1250 and $1500
Disclaimer
The views and opinions stated by the author, or any people named in this article, are for informational ideas only, and they do not establish financial, investment, or other advice. Investing in or trading crypto assets comes with a risk of financial loss.