The market is showing no power as almost all coins are in the red zone.
ETH/USD
Ethereum (ETH) is following the decline of Bitcoin (BTC), going down by 7.32% over the last day.
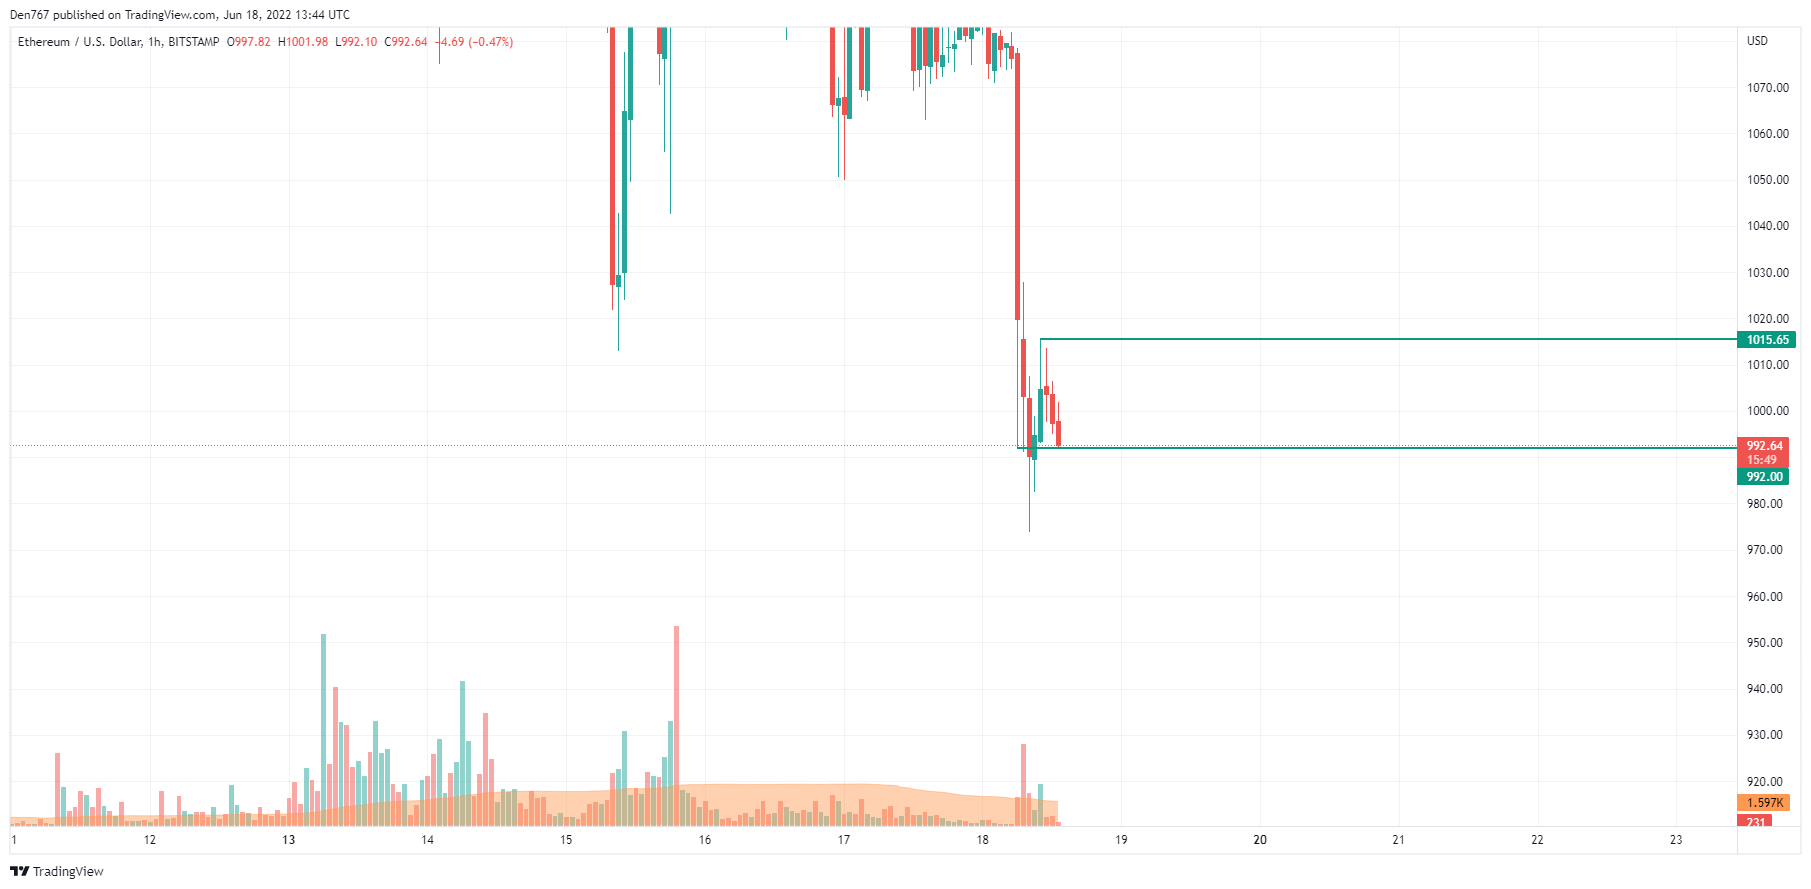
On the hourtly chart, Ethereum (ETH) is coming back to the recently formed support level at $992. If the rate remains trading below the important $1,000 mark until the end of the day, one can expect a further decline to the $950 zone soon.
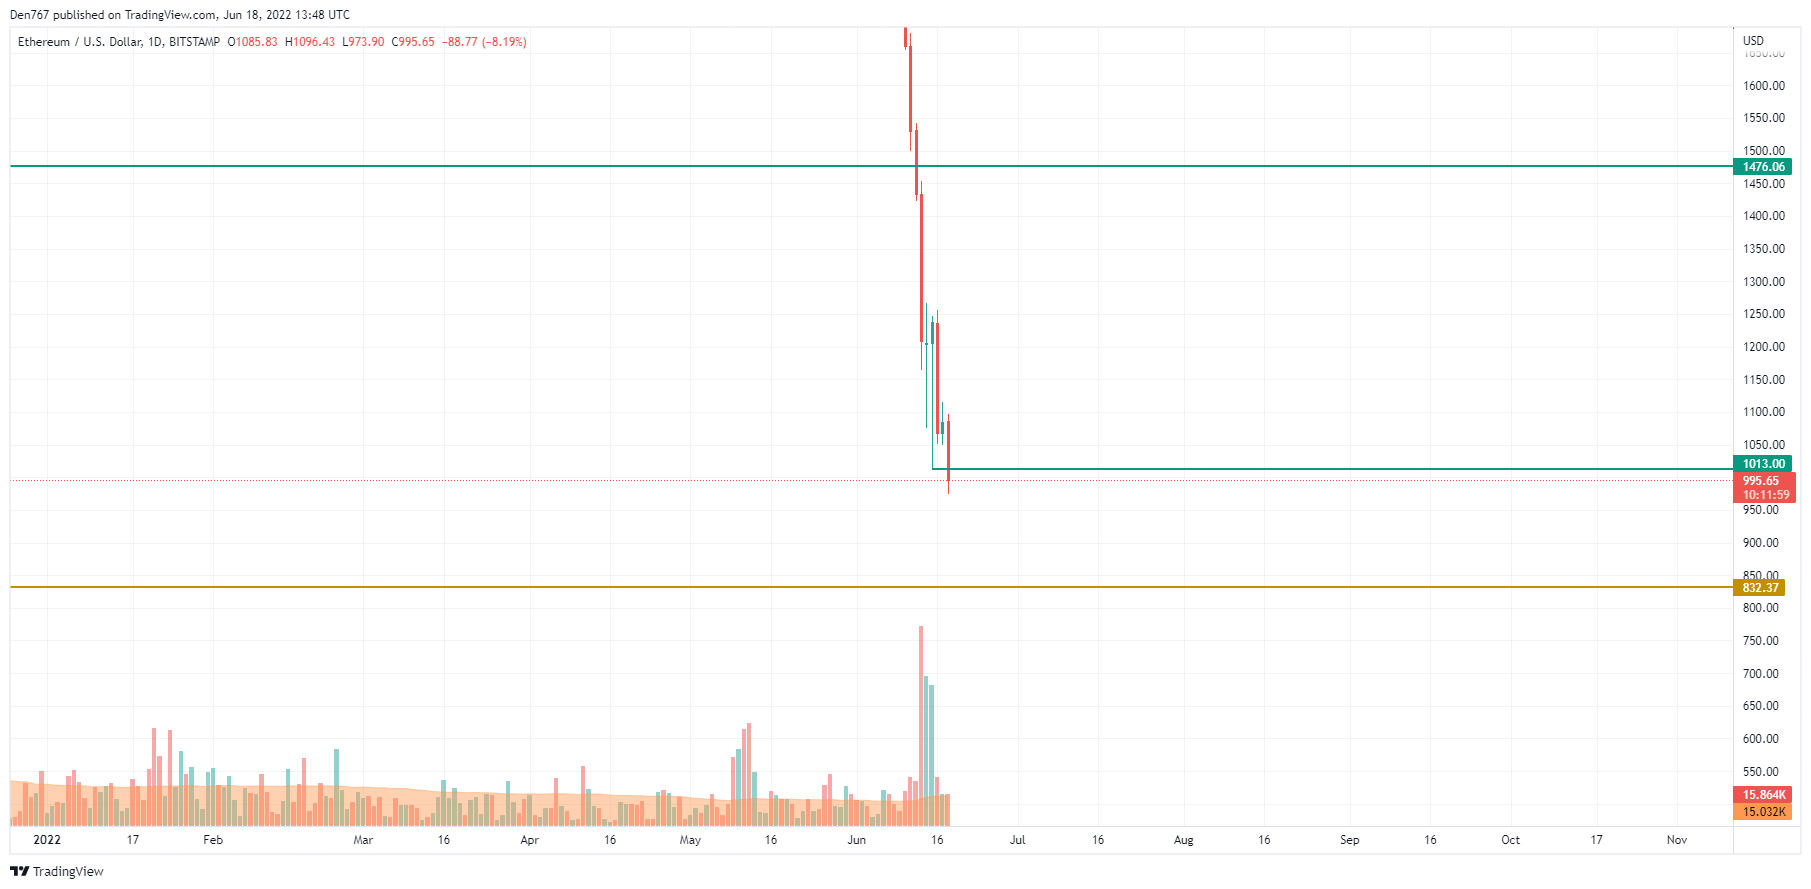
On the daily time frame, the situation is worse as Ethereum (ETH) has broken the $1,000 mark, which means that the continued fall might not have finished yet. If buyers cannot seize the initiative, traders can see the price of the main altcoin around the next support at $832.
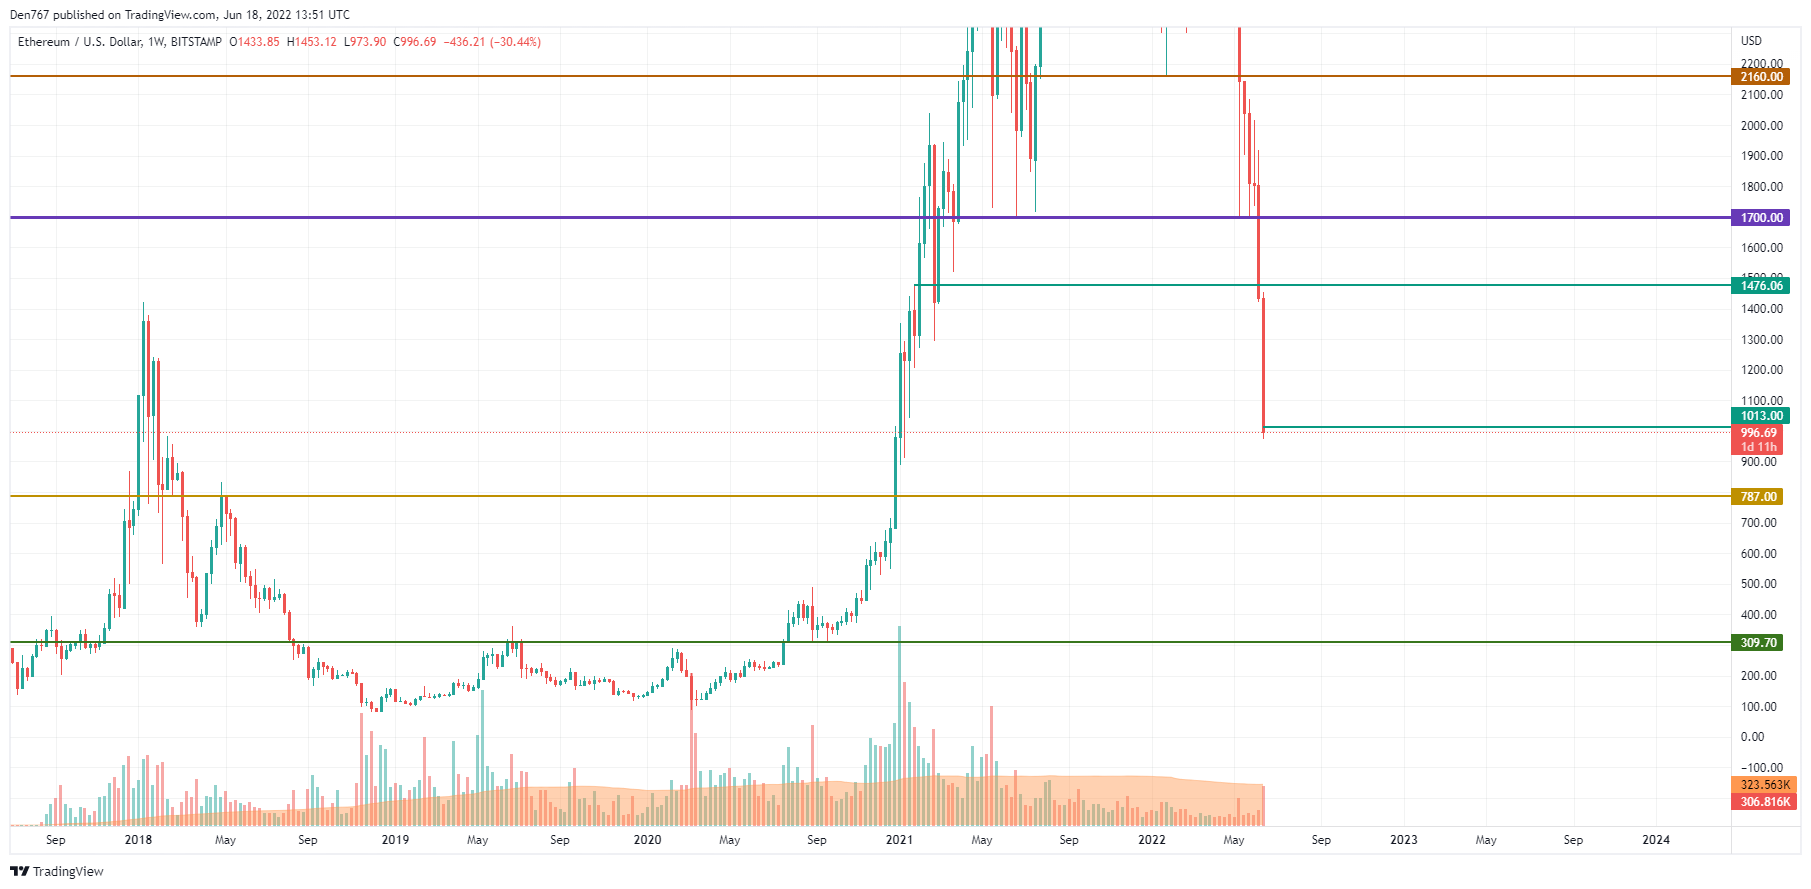
On the weekly chart, nothing is positive, as Ethereum (ETH) is about to close the candle below $1,000. The selling volume is high, which means that bears keep dominating over bulls. Likewise, the next level at which buyers can get back in the game is the $787 mark.
Ethereum is trading at $998 at press time.