Same as happened in early February, the bulls have taken control of the ETH-USD market.
However, this time it may be different, as ETH was able to overcome significant resistance and is also forming a higher high above $3300, which is technically one of the major signs for a downtrend reversal.
The Daily Chart
Technical Analysis by Grizzly
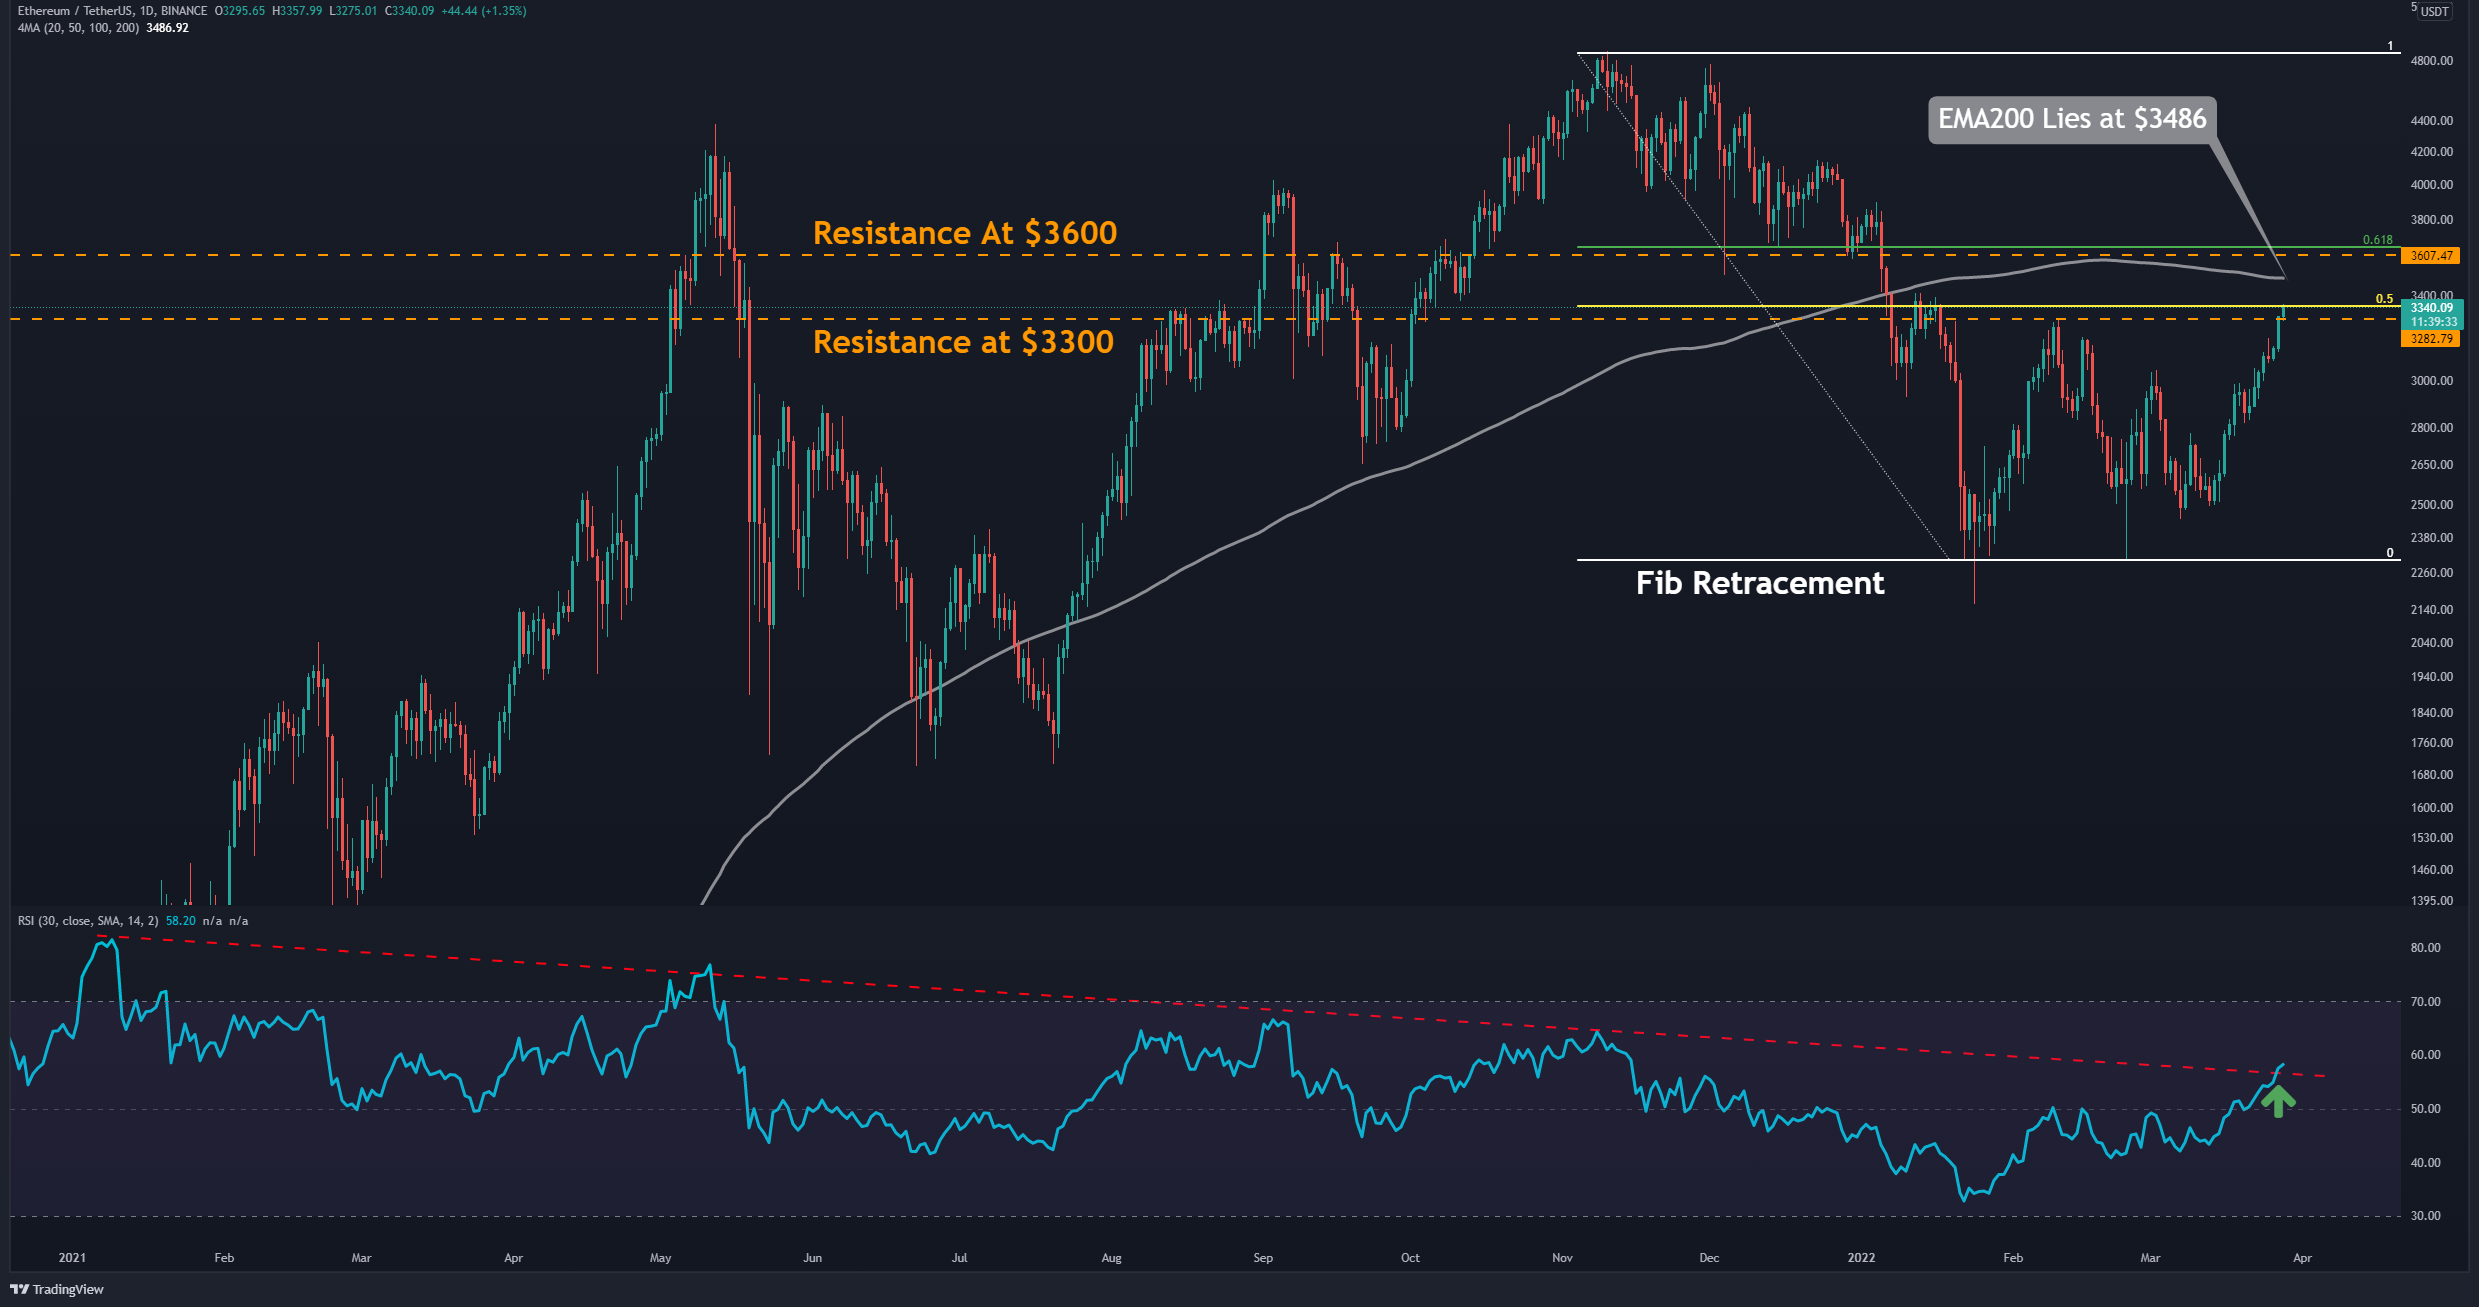
On the daily timeframe, after ETH was able to cross the psychological resistance at $3K, everyone waited to breach the resistance at $3300 to form a higher high (yesterday’s daily close exactly at $3300 according to Bitstamp).
Unless we get a last-minute surprise, ETH was finally able to break above $3300 for the first time in over 2 months
In addition, ETH has recovered almost 50% from the downtrend and also RSI 30-day was able to cross above the significant descending trendline (marked by red) after a long while
Currently, the resistance levels for ETH are as follows:
The static resistance at $3600 and Fibonacci retracement 0.618 (marked by green) as well as the EMA-200, which lies at $3486.
Breaking above these resistance levels does not seem to be easy and we have to wait and see if the dream days will continue. If the bears defend these areas, ETH has the potential to rebound on the supports at $3400 and $2800 on the daily timeframes.
Moving Average Exponential levels
EMA20: $2870
EMA50: $2842
EMA100: $3050
EMA200: $3486
The 4-Hour Chart
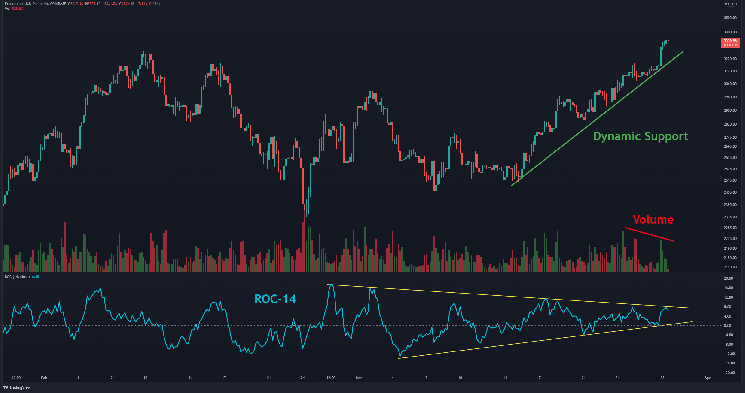
On the 4-hour timeframe, Ethereum is trading amid a dynamic support (marked on the chart by green), and on the other hand, the ROC-14 indicator lies inside the triangle (marked by yellow).
A breakout of this triangle to either side should indicates the next direction for ETH. Divergences seems to be forming and the trading volume has also decreased (marked by red). After this parabolic run it is better to be more cautious.
Short-term Support Levels: $3200 & $3000
Short-term Resistance Levels: $3400 & $3500
On-chain analysis: Taker Buy/Sell Ratio (SMA7)
SMA7 is defined as the ratio of the buy volume divided by the takers’ sell volume in perpetual swap trades. Values over 1 indicate that bullish sentiment is dominant, whereas values below 1 indicate that bearish sentiment is dominant.
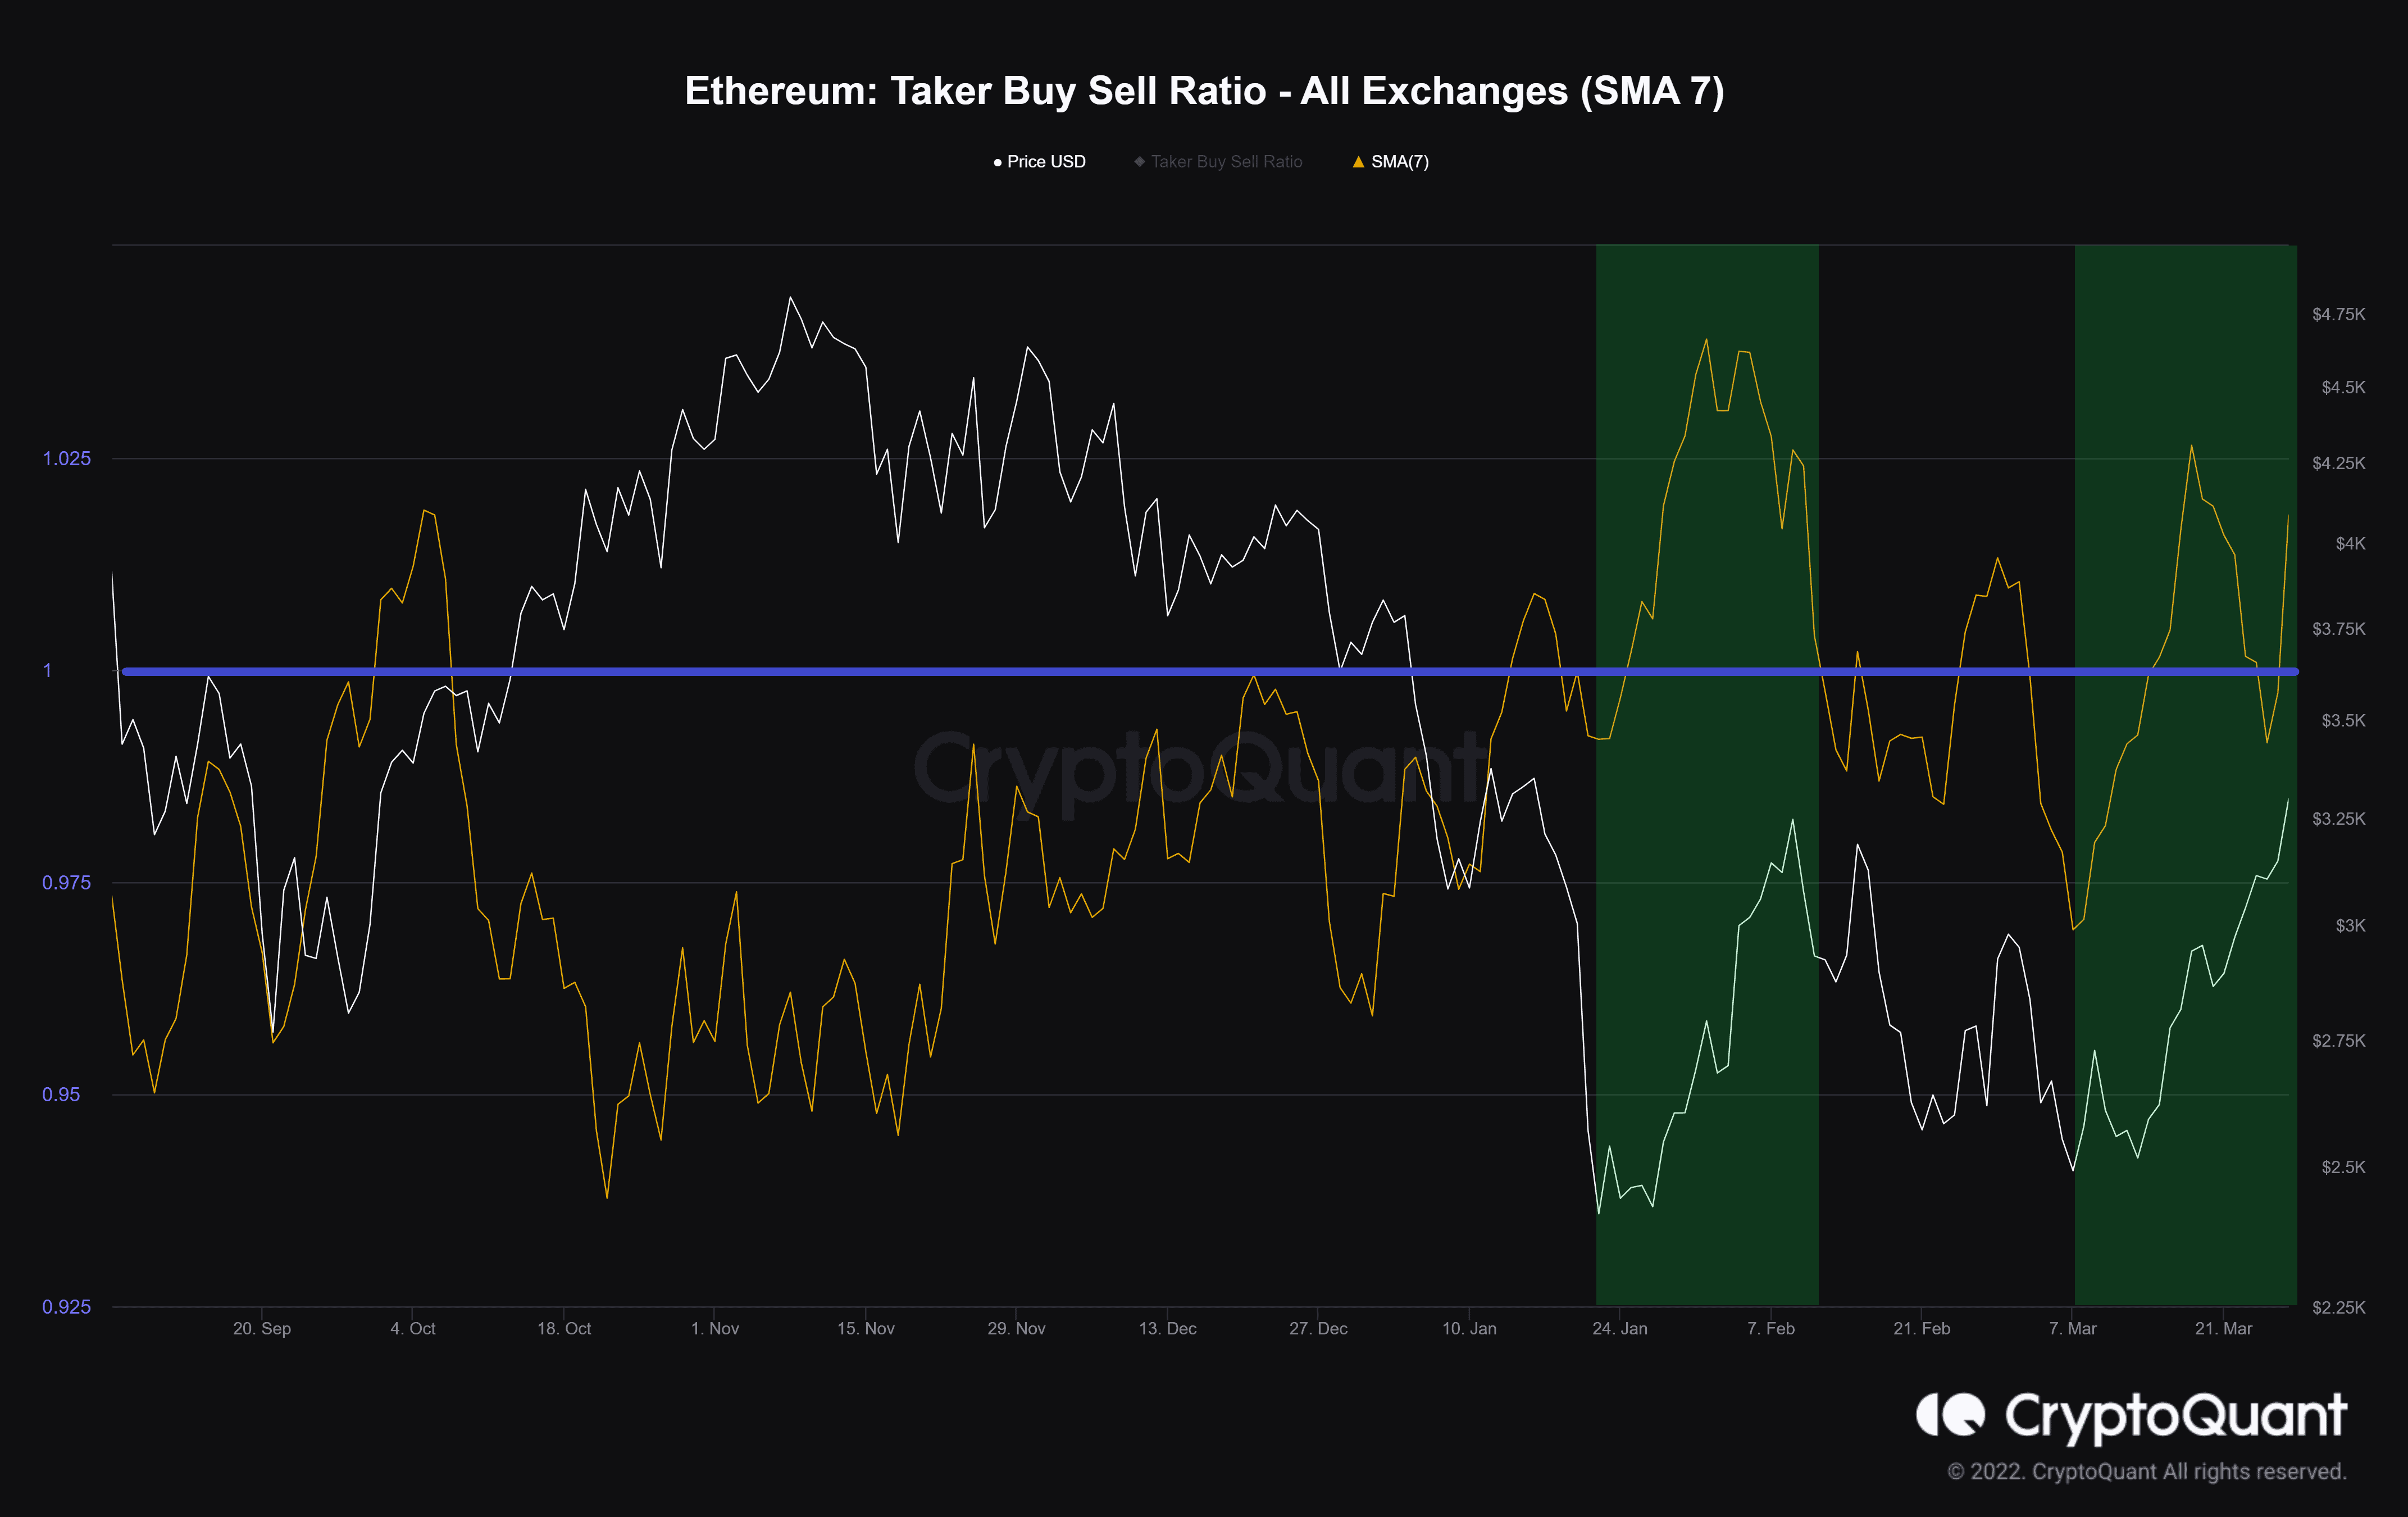
As we can see, Takers on the buy side have more power than takers on the sell side, which is unprecedented in the recent downtrend from the all-time high
It’s worth mentioning that this metric can not be used as a definite buy or sell signal, but reflects the sentiment in the derivative market.