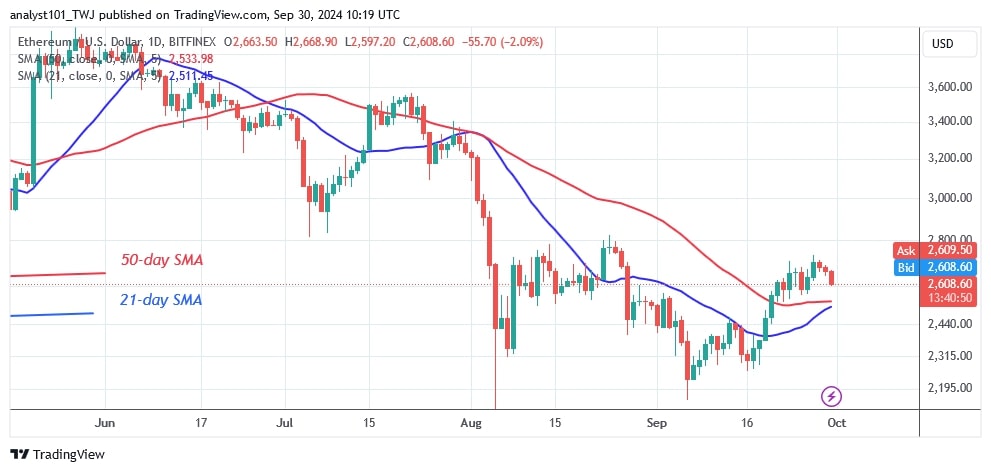
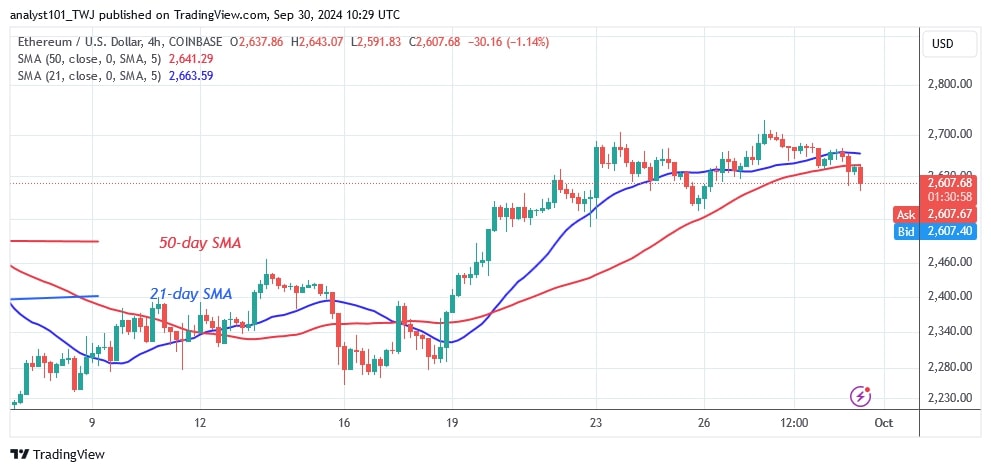
The price of Ethereum (ETH) was moving in an uptrend range after breaking the moving averages and rose to a high of $2,732 but was then rejected.
The uptrend was halted when Ether fell back above the $2,500 support.
Ether fell when the bears broke below the moving average lines or the $2,500 support. The largest altcoin returns to the key support at $2,300.
Ethereum indicator analysis
After the current drop, Ether's price bars are now above the moving average lines.
Ether's price bars remain below the moving average lines, indicating that the cryptocurrency will continue to plummet.
Technical Indicators:
Major Resistance Levels – $4,000 and $4,500
Major Support Levels – $3.500 and $3,000

What is the next direction for Ethereum?
Yesterday, the upward surge was resisted by the moving average lines, implying a possible bitcoin downturn. On October 2, ETH price is $2,431.

Disclaimer. This analysis and forecast are the personal opinions of the author. They are not a recommendation to buy or sell cryptocurrency and should not be viewed as an endorsement by CoinIdol.com. Readers should do their research before investing in funds.
 coinidol.com
