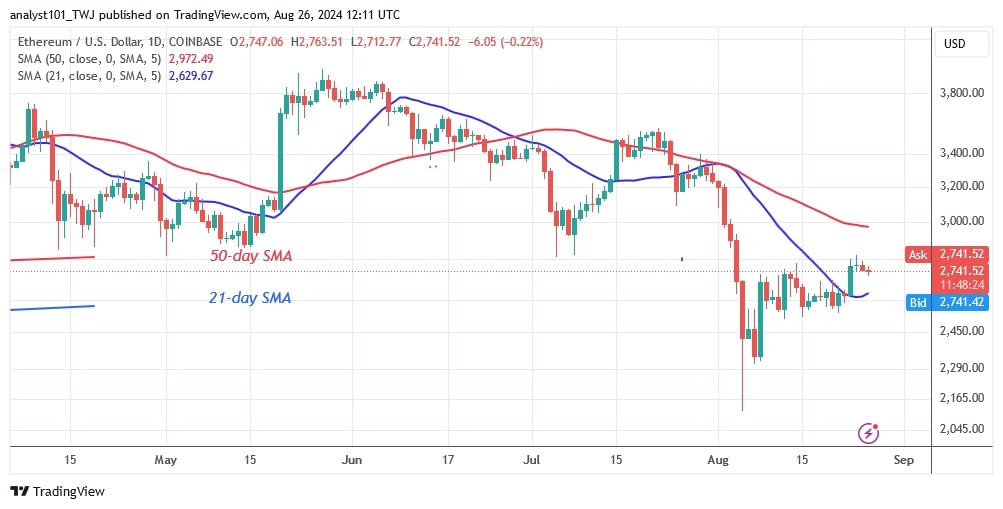
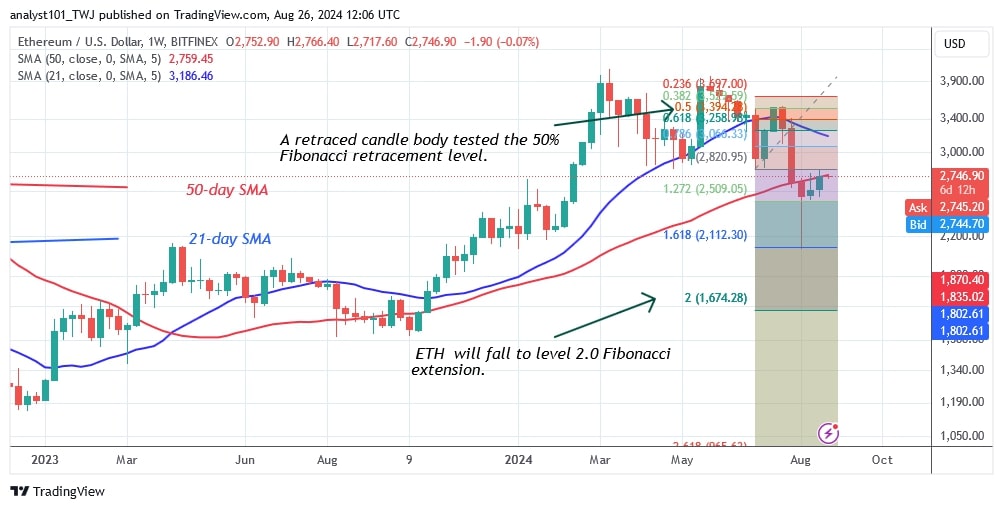
The price of Ethereum (ETH) is in an upward correction after breaking above the 21-day SMA.
Long-term analysis of ETH price: bearish
The bullish momentum should have risen to the 50-day SMA or the high at $3,000 on the daily chart. However, the bullish momentum has peaked above $2,800. The previous price and support level from April 13 was $2,800.
On August 4, the bears broke through the $2,800 support and continued their decline to a low of $2,116.
Today, the largest altcoin has recovered but remains between the moving average lines. If the bulls overcome resistance at $2,800 and the 50-day SMA, Ether could reach a high of $3,400. If the bears break the 21-day SMA support, Ether will fall to its low at $2,200. Ether is currently trading at $2,685.
Ethereum indicator analysis
Ethereum is pulling back from its recent high but remains trapped between the moving average lines. On the daily chart, the price of the cryptocurrency has retreated and is still above the 21-day SMA support but below the 50-day SMA resistance. This means that Ether can only move in a range between the moving average lines.
Technical Indicators:
Key Resistance Levels – $4,000 and $4,500
Key Support Levels – $3.500 and $3,000

What's next for Ethereum?
Ether has come back and reached a high of $2,800. The upward correction has been halted and Ether has retraced to the previous low.
On the downside, selling pressure will pick up again if the bears drop below the current support of $2,600. The altcoin could fall back to its previous low of $2,200.

Coinidol.com reported on August 24 that Ether was traded at $2,668.
Disclaimer. This analysis and forecast are the personal opinions of the author. They are not a recommendation to buy or sell cryptocurrency and should not be viewed as an endorsement by CoinIdol.com. Readers should do their research before investing in funds.
 coinidol.com