- The daily chart for Ethereum
shows a strong buying momentum from the $2867 – $2950 range, pushing its price up to $3100. - For long-term investors, daily candle closures below $2860 can be considered a stop-loss level.
- If ETH manages to close weekly candles above $2860, it is believed that the targets could sequentially be $3411 and $3722.
Ethereum’s daily chart has sustained a rise up to $3100 after strong buying in the $2867 – $2950 range. Current ETH Analysis
MID-TERM ETH ANALYSIS
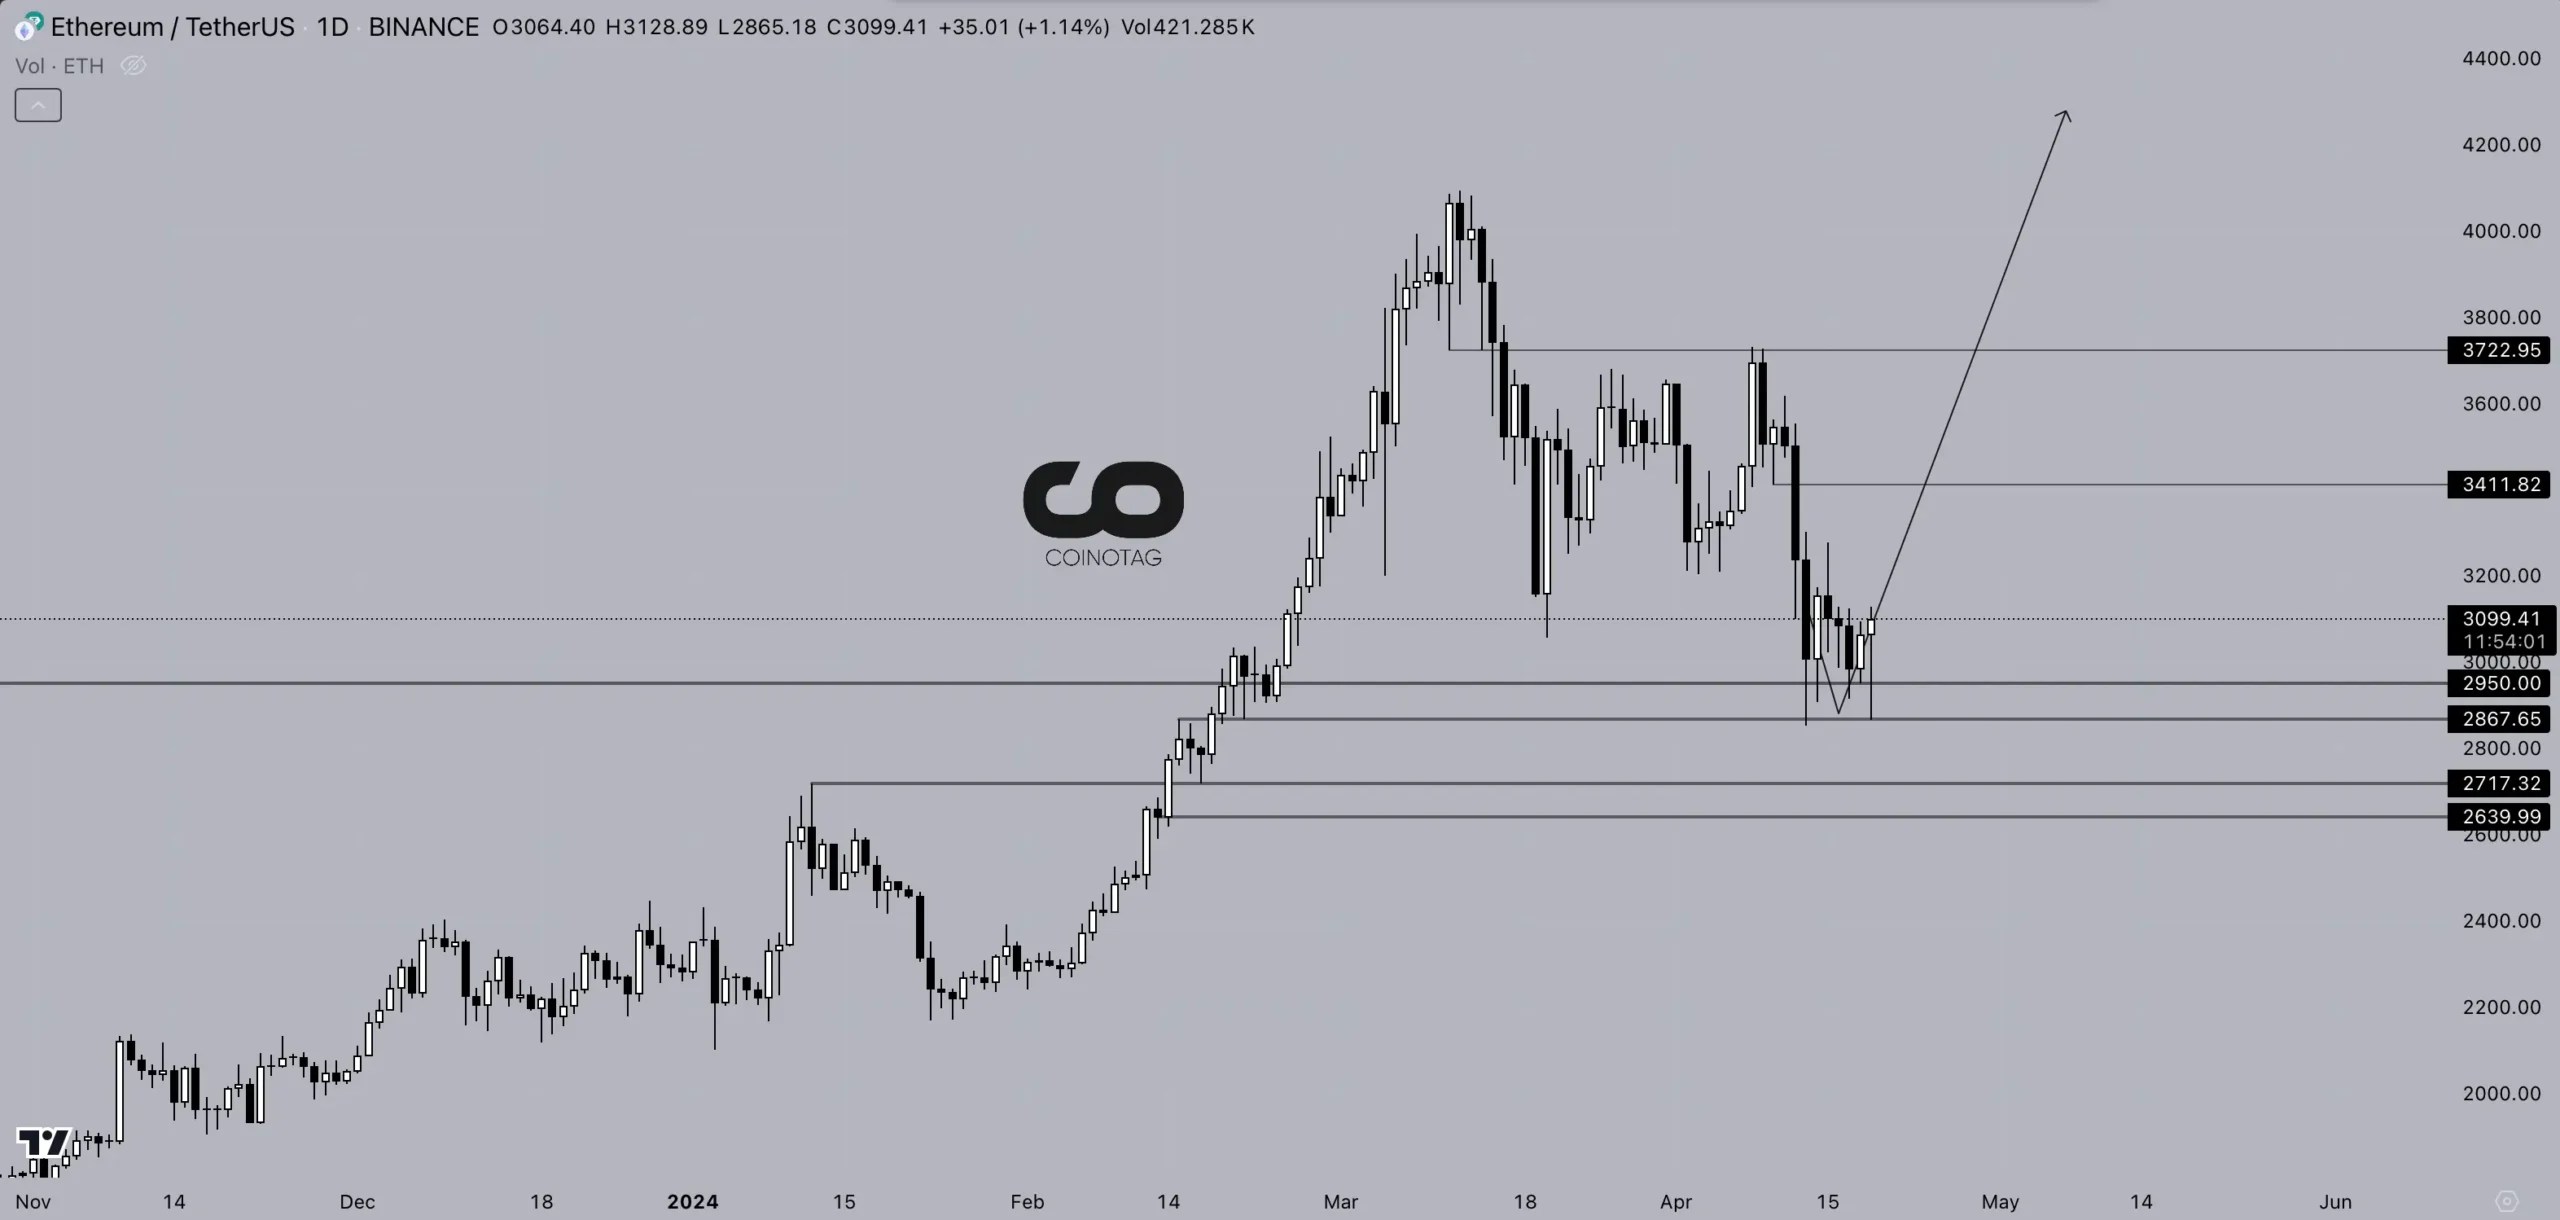
Daily ETH/USDT Price Chart
Upon examining Ethereum’s daily chart, we see that it has risen to $3100 due to strong buying from the $2867 – $2950 weekly support zone.
For long-term ETH investors, it can be advisable to consider daily candle closures below $2860 as a stop for spot investments.
As long as ETH closes weekly candles above $2860, the next targets are $3411 and $3722, respectively. Thus, potential investors might hold their long-term spot investments in Ethereum as long as we observe weekly candle closures above $2860.