Ethereum price rallied above the $1,700 resistance against the US Dollar. ETH might correct lower and test the $1,650 support zone before a fresh increase.
- Ethereum started a major increase above the $1,650 resistance zone.
- The price is trading above $1,650 and the 100 hourly simple moving average.
- There is a major bullish trend line forming with support near $1,690 on the hourly chart of ETH/USD (data feed via Kraken).
- The pair could correct lower, but dips might be limited below the $1,650 support.
Ethereum Price Eyes More Gains
Ethereum price started a major increase above the $1,600 resistance zone. ETH even cleared the key $1,700 resistance zone to move further into a positive zone, similar to bitcoin.
Finally, the price spiked above the $1,740 resistance and traded close to $1,800. A high was formed near $1,784 before there was a downside correction. There was a sharp decline below the $1,700 level. The price tested the $1,665 support zone and traded as low as $1,666.
Ether price is now trading above $1,650 and the 100 hourly simple moving average. There is also a major bullish trend line forming with support near $1,690 on the hourly chart of ETH/USD.
On the upside, the price is facing resistance near the $1,725 zone. It is near the 50% Fib retracement level of the recent decline from the $1,784 swing high to $1,666 low. The first major resistance is near the $1,740 and $1,750 levels.
The 76.4% Fib retracement level of the recent decline from the $1,784 swing high to $1,666 low is also near $1,750. The next major resistance is near the $1,800 level. A close above the $1,800 resistance zone might start another major increase.
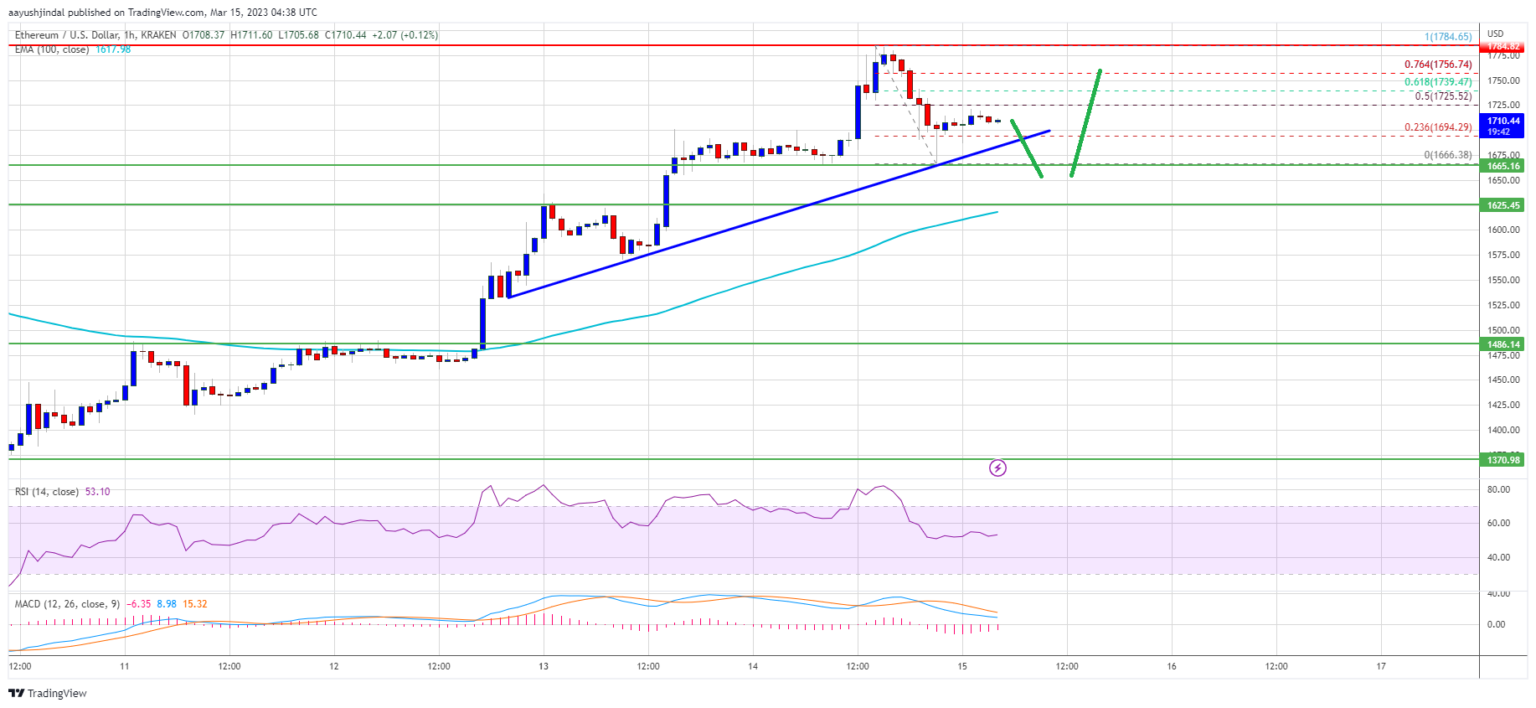
Source: ETHUSD on TradingView.com
In this case, the price may perhaps rise towards the $1,880 resistance level. Any more gains might send the price towards $2,000.
Dips Supported in ETH?
If ethereum fails to clear the $1,740 resistance, it could start another decline. An initial support on the downside is near the $1,690 level and the trend line.
The next major support is near the $1,650 zone. If there is a break below $1,650, the price might drop towards $1,600. Any more losses might call for a test of the $1,550 level.
Technical Indicators
Hourly MACD – The MACD for ETH/USD is now losing momentum in the bullish zone.
Hourly RSI – The RSI for ETH/USD is now above the 50 level.
Major Support Level – $1,650
Major Resistance Level – $1,740