
A crypto trader and analyst took to Twitter on January 2 to share some of his thoughts on the price of the largest altcoin by market cap, Ethereum (ETH). According to the post, ETH is trying hard to put in a higher low on its 4-hour chart. The analyst also pointed out a breakout on ETH’s chart.
The analyst also added that he would not be surprised if ETH could reach as high as $1,260 or $1,270 in the coming days.
CoinMarketCap indicates that ETH is one of the crypto in the green for the day and it is currently trading at $1,215.70 after a 1.74% increase in price over the last 24 hours. The altcoin is still, however, down by 0.34% over the last week.
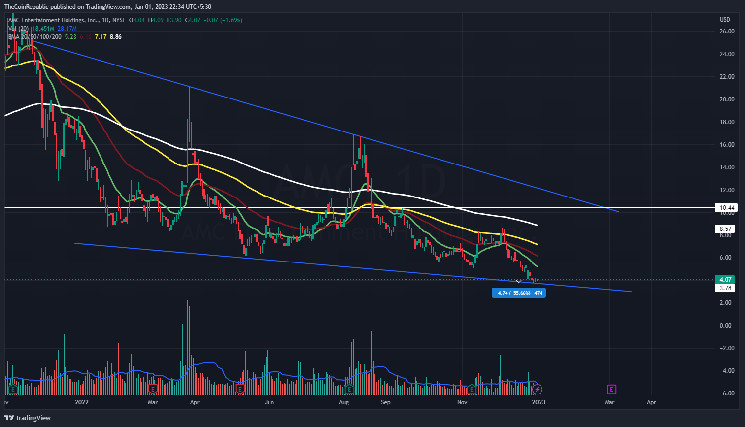
The price of ETH has risen above the 9-day EMA line and is looking to do the same with the 20-day EMA line. The flat trading volume on ETH’s chart at press time suggests that ETH’s challenge at the 20-day EMA line will not be successful.
The daily RSI indicator, on the other hand, is steeply sloped toward the overbought territory and crossed above the daily RSI SMA line yesterday.
Should ETH’s price break above the 20-day EMA line, then the next thing to look out for is a bullish cross between the 9-day and 20-day EMA lines. This will see ETH’s price make a move toward $1,259.
However, if ETH’s price is unable to break above the 20-day EMA level before the close of today’s trading session, then it will be brought back down by bears – leaving it at risk of dropping to the closest support level at $1,165.27.