The Ethereum price has moved in the same direction as the broader market. In the last 24 hours, Ethereum has moved up by 2.5%. On the weekly timeframe, the altcoin has rarely registered any movement. This reflects lateral trading for ETH.
In the short term, the altcoin might be registering gains, but as the technicals indicate, the coin can depreciate again before it rallies. Accumulation has been considerably low on the chart. Buying activity must significantly increase if ETH is to break above the $1,300 price mark.
Even though ETH remained comfortably above the $1,220 price, buying strength has been weak on the daily chart. Ethereum has to keep trading above the $1,240 and $1,250 price levels for the coin to take a shot at $1,300. The bulls will lose all strength if the Ethereum price moves below the $1,240 mark and closes near $1,230. This price pullback can then further fuel a rally to $1,300.
Ethereum Price Analysis: One-Day Chart
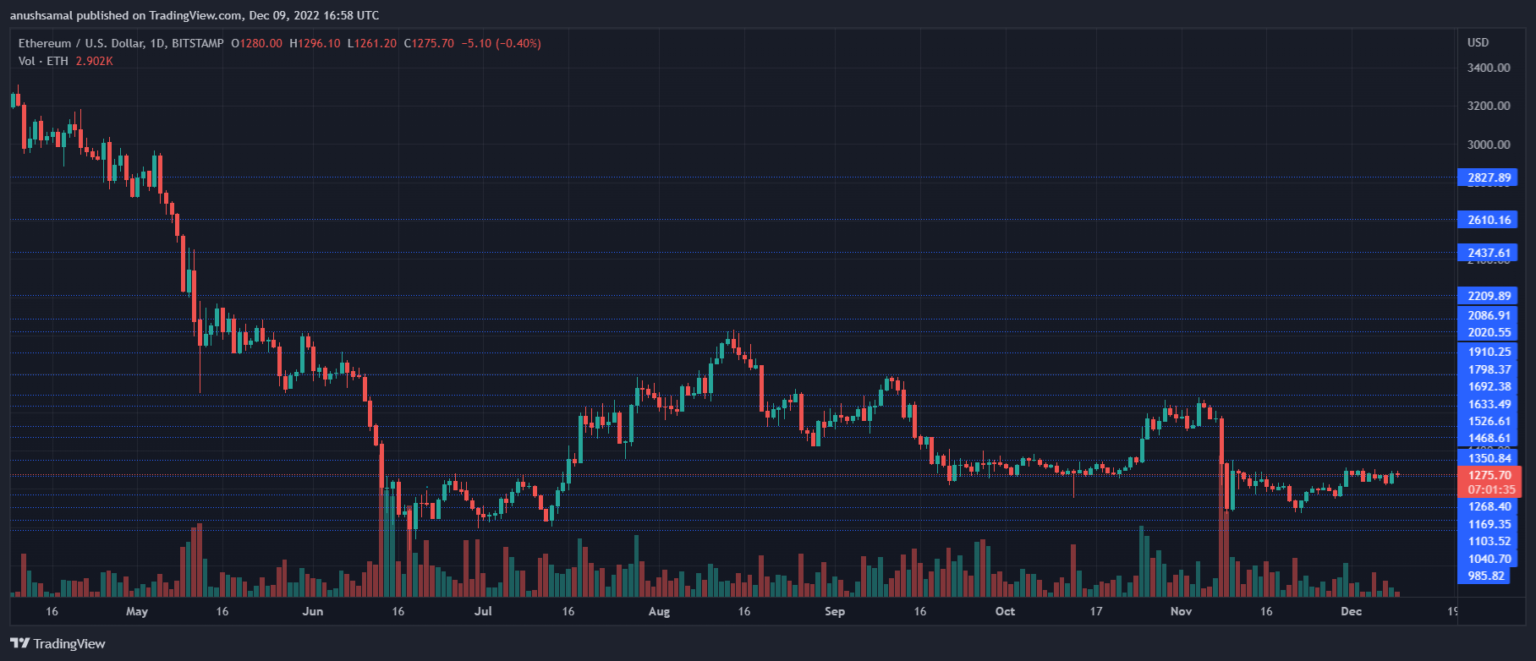
ETH was trading at $1,275 at the time of writing. The coin is presently consolidating after flipping the $1,240 level as support. Immediate resistance for Ethereum stood at $1,290; the coin is expected to encounter a setback at that level.
However, ETH must stay above $1,250 to avoid a significant loss of value. The bulls must keep defending the $1,250 level regarding the closest support line. The amount of Ethereum traded in the last session declined slightly, indicating a fall in the number of buyers in the market.
Technical Analysis
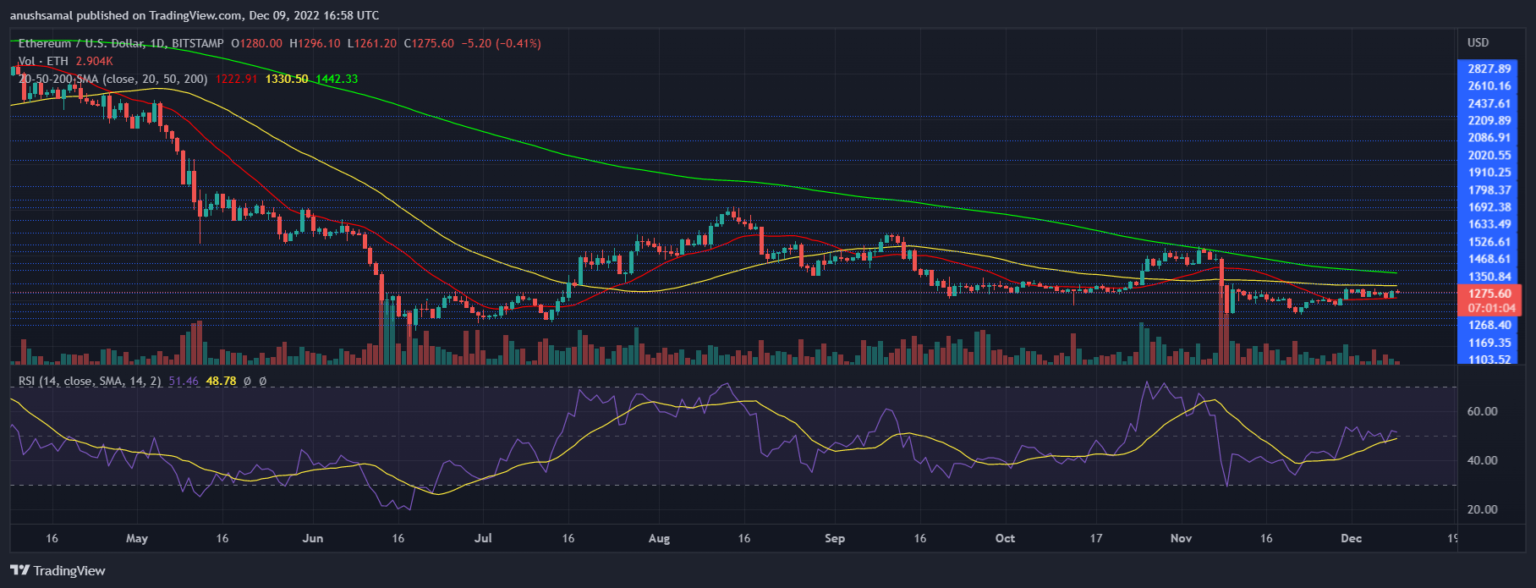
Corresponding to the earlier statement about low buyers, the technical outlook also painted the same picture. Although above the half-line, the Relative Strength Index remained weak as it displayed a downtick on the daily chart.
This reading is associated with a fall in demand and accumulation. On the contrary, the Ethereum price was above the 20-Simple Moving Average. The indicator depicted that ETH was in the hands of the buyers, as the buyers were driving the price momentum in the market.
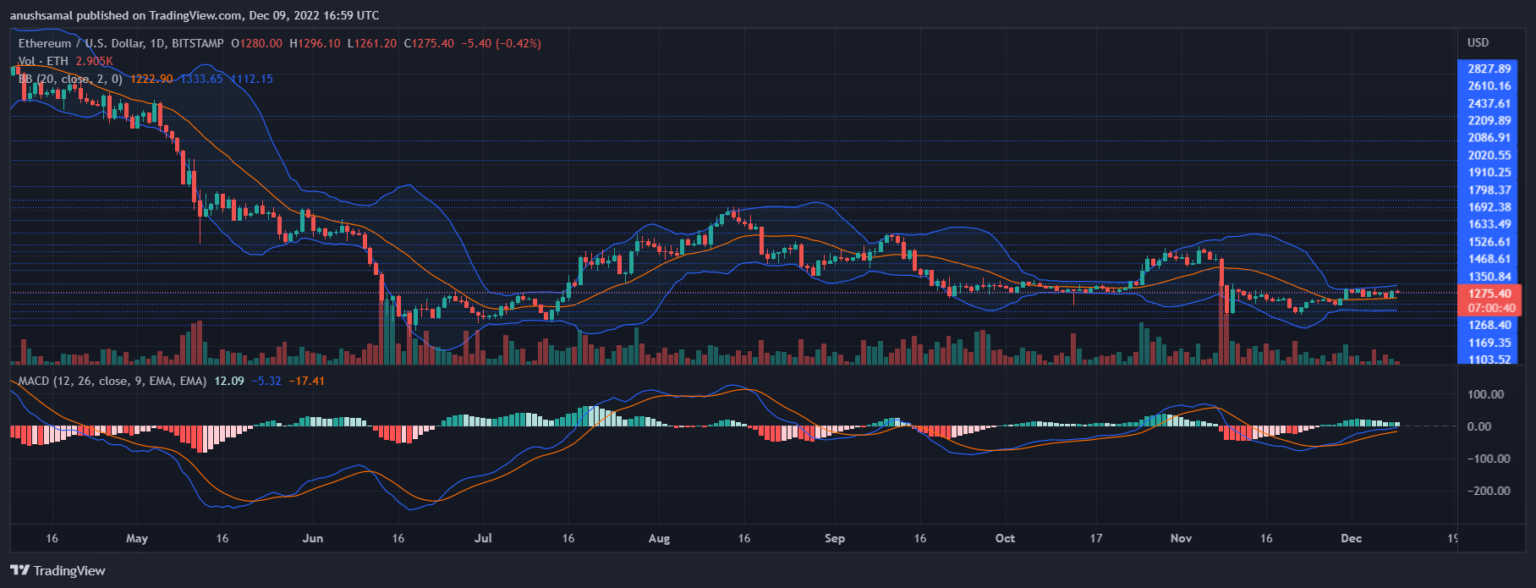
With buyers still under some control of the price, the Moving Average Convergence Divergence (MACD) reflected the same sentiment. MACD indicates price movements and trend reversals; the indicator displays small green signal bars tied to the buy signal for ETH.
However, it is to be remembered that the signals were declining in height, indicating a fall in demand. Bollinger Bands demonstrate the chance of price fluctuation and volatility in the market. Because the bands remained parallel, Ethereum is expected to trade within a range in the coming trading sessions.