Ethereum’s price dropped over the last 24 hours according to the crypto market tracking website, CoinMarketCap. At press time, the price of ETH stands at $1,176.88 after a 24-hour drop of 2.06%. In addition, the price of ETH has weakened against Bitcoin (BTC) by 0.49% in the same time period.
Trading volume for ETH has also dropped 18.25%, taking the total daily trading volume down to $9,036,397,215.
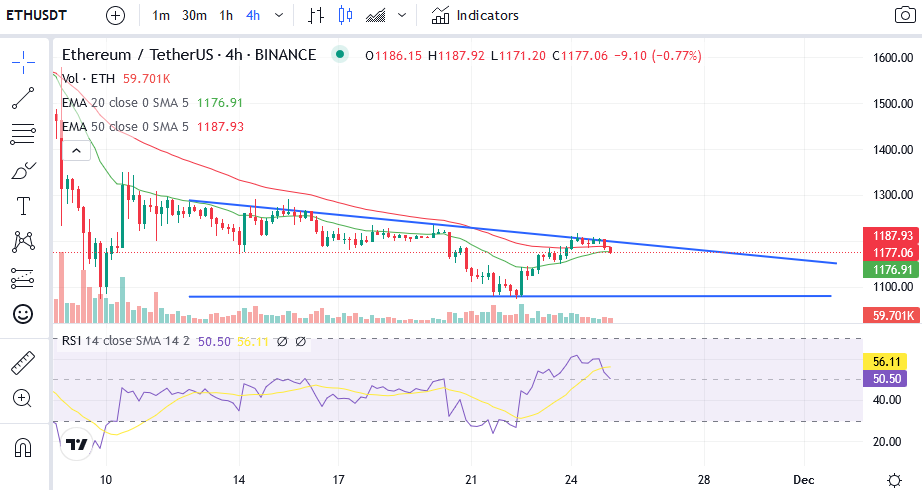
There is a descending triangle pattern forming on ETH’s 4-hour chart which signals bearish momentum. As a result, the price of ETH may continue to drop over the next 2-3 days. The market may be looking to wipe out all stop loss orders above the swing high at $1,234, which is also at the 0.618 Fibonnaci level.
The price of ETH is currently being held up by the 4-hour 20 and 50 EMA lines. The price of the altcoin is looking to break above the bearish chart pattern. If it fails to do so and it drops below the 20 and 50 4-hour EMA lines within the next 8 hours, then the bearish thesis will play out.
This may be a great opportunity to enter into a short position on futures. Furthermore, investors and traders may look to short all ETH price pumps until ETH’s price reaches $882, which is the previous swing low from 18 June of this year.
Crypto will likely continue its biggest crash in history. This could push ETH’s price down to $400 next year and BTC’s price down to $10,000 next year.
Disclaimer: The views and opinions, as well as all the information shared in this price analysis, are published in good faith. Readers must do their own research and due diligence. Any action taken by the reader is strictly at their own risk. Coin Edition and its affiliates will not be held liable for any direct or indirect damage or loss.