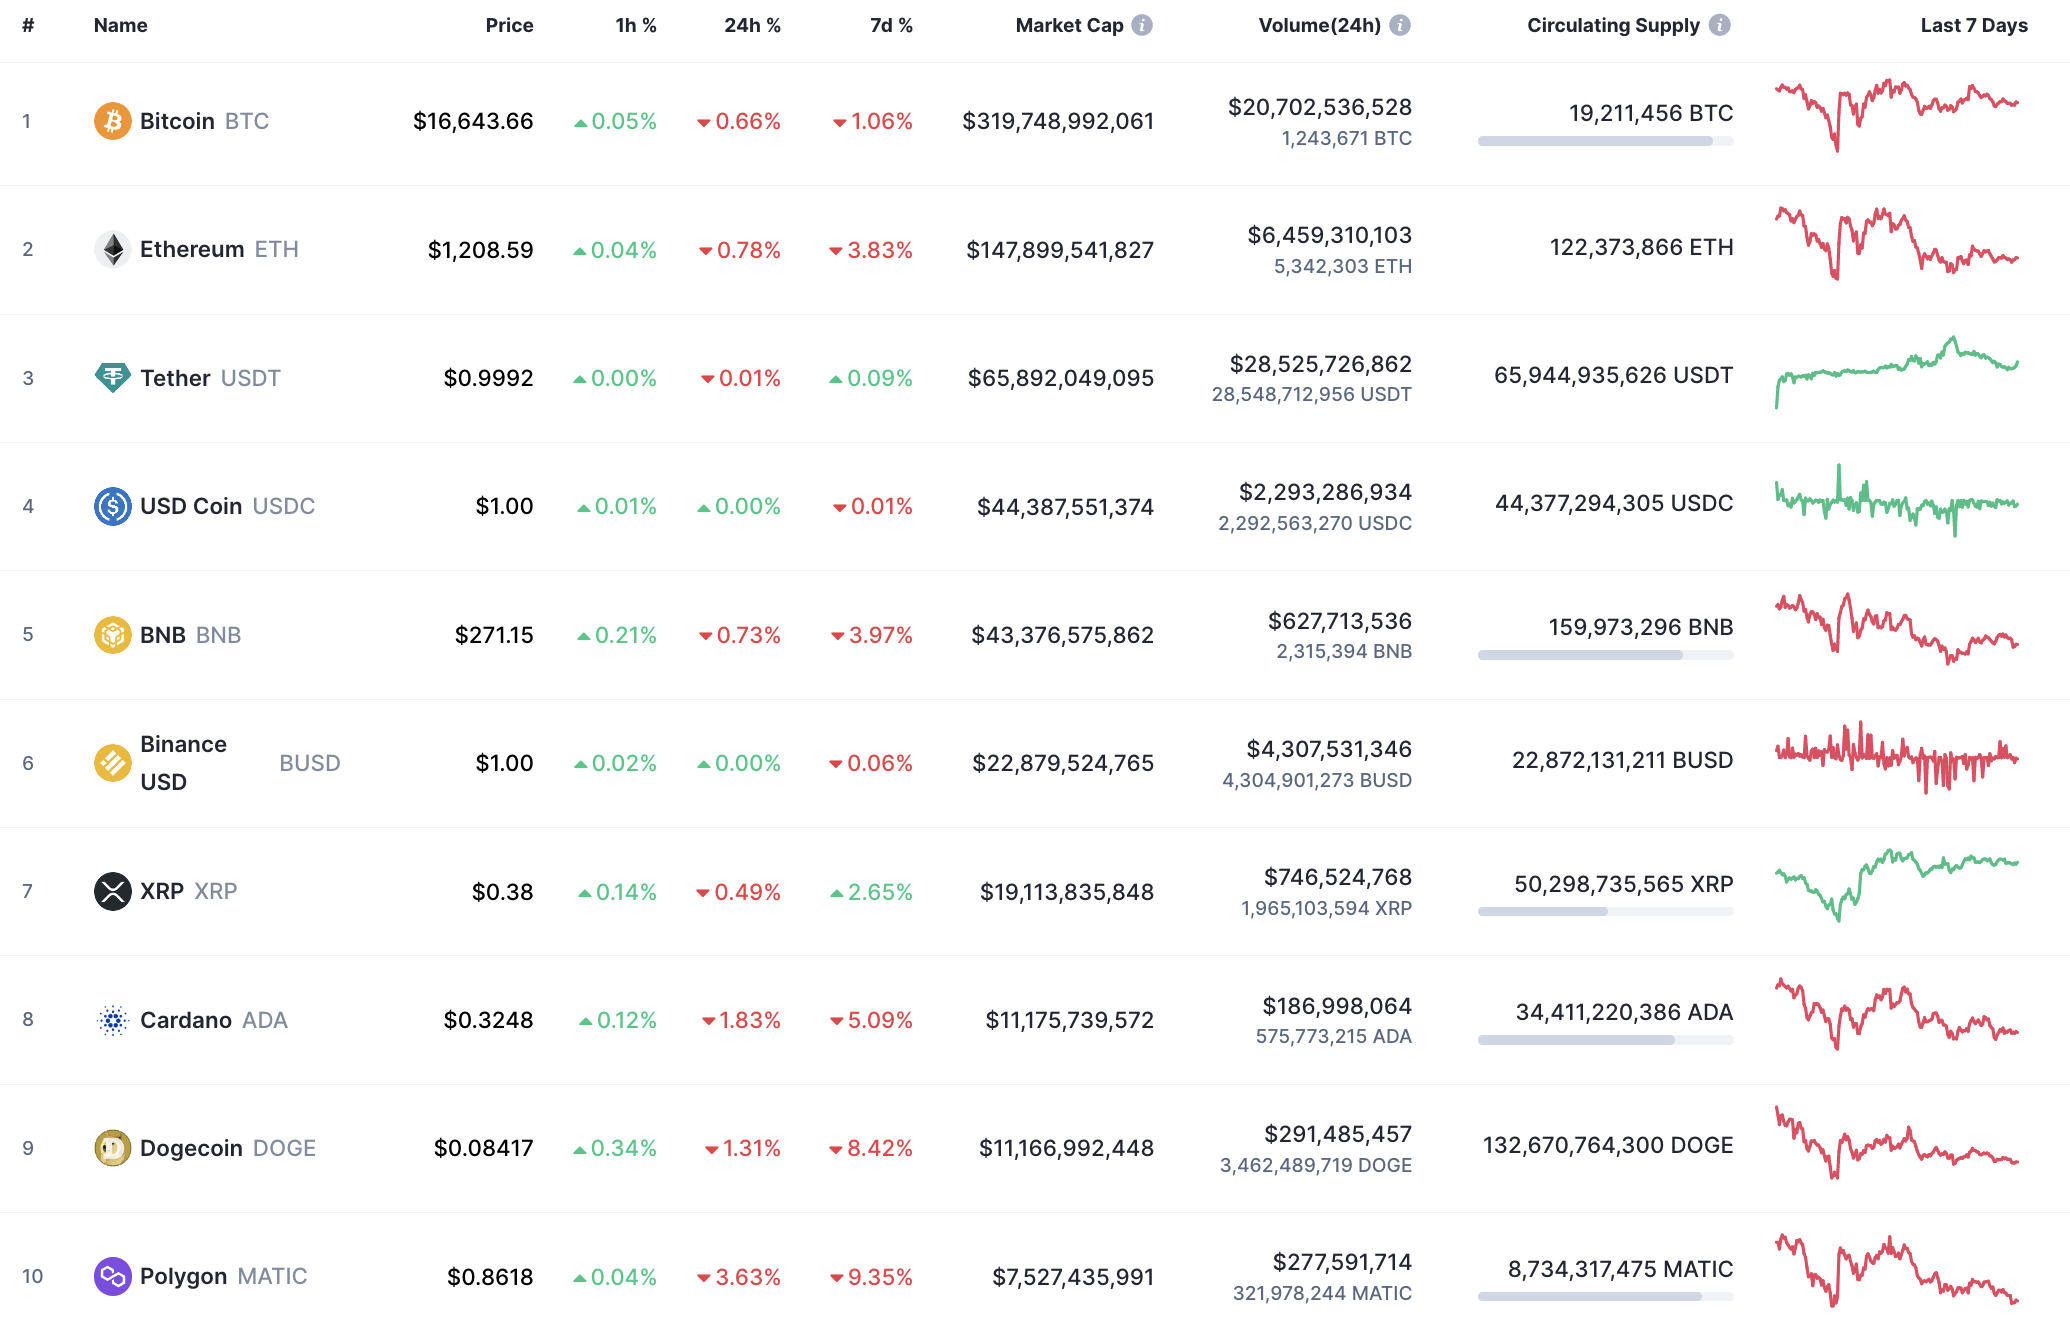
Bulls could not keep up yesterday's growth, and most of the coins are back in the red zone.
ETH/USD
The rate of Ethereum (ETH) has declined by 0.78% over the last 24 hours.
ETH/USD chart by TradingView" size="2074}" src="https://cnews24.ru/uploads/c6a/c6a6bdfc21796b6f61b5513e62ca5a5f5202af5a.png">
Despite the fall, Ethereum (ETH) has started the day with a false breakout of the local support level at $1,200. At the moment, the rate is slowly approaching the resistance at $1,210.
If the situation does not change, the rise may lead to a test of the $1,220 zone soon.
ETH/USD chart by TradingView" size="3494}" src="https://cnews24.ru/uploads/b58/b58ba8bbbd72949fc0c4aa75ededd955f43ac9d9.png">
On the daily chart, Ethereum (ETH) keeps trading sideways as the rate is far from the key levels. However, if buyers lose the $1,200 area, one can expect a sharp move to $1,100 by the end of the week.
ETH/USD chart by TradingView" size="4896}" src="https://cnews24.ru/uploads/d7a/d7a1b3254b46165222323e3d0ef79ebdaaa5c0c9.png">
Ethereum (ETH) is trading near the support level formed by the false breakout at $1,155. The selling volume remains high, which means that bears are more powerful than bulls at the moment. Respectively, the more likely scenario is a decline to the important level at $1,000.
Ethereum is trading at $1,207 at press time.