- Ethereum price prediction suggests the consolidation phase of EETH crypto over the daily price chart.
- ETH crypto is trading below 20, 50, 100 and 200-days Daily Moving Average.
- The pair of ETH/BTC is at 0.07527 BTC with an intraday gain of 2.69%.
The cost of ethereum has significantly dropped during the past two trading sessions. The ETH cryptocurrency’s daily price chart reveals some intriguing trading patterns. The ETH cryptocurrency originally exhibited a head and shoulders pattern throughout the chart, which was followed by a consolidation stage. Then it came across short-selling as it dipped slightly to gather support and then rose once more to form a head and shoulder pattern.
The estimated price of Ethereum is currently $1275, and over the last day, it has increased in market value by 0.21%. However, trade volume decreased by 35.98% during the intraday trading session. This demonstrates that the cryptocurrency is under pressure from short sellers, while bulls are striving to break the trend and let the price surge toward the upper trendline.
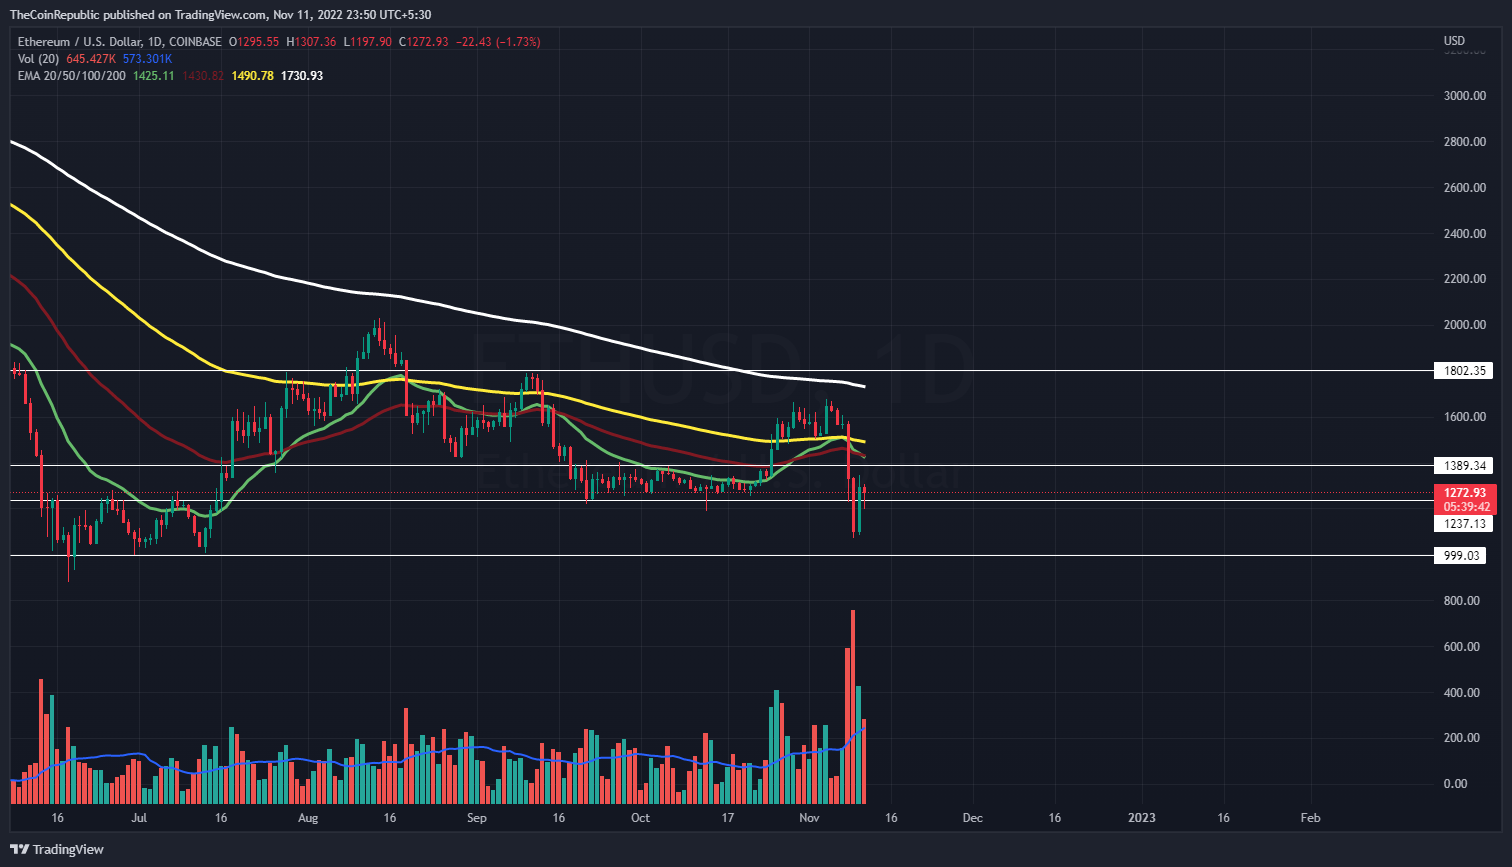
Ethereum must continue to draw buyers if it is to ascend once again toward the consolidation period’s top trendline. The volume shift shows that the amount of negative pressure is at its peak and that bulls are now actively trying to maneuver the cryptocurrency to their favor. To change the tug-of-war between the bulls and bears, bulls must drastically boost their accumulation, and ETH must experience purchasers rather than sellers during the intraday trading session.
What do Technical Indicators suggest about ETH?
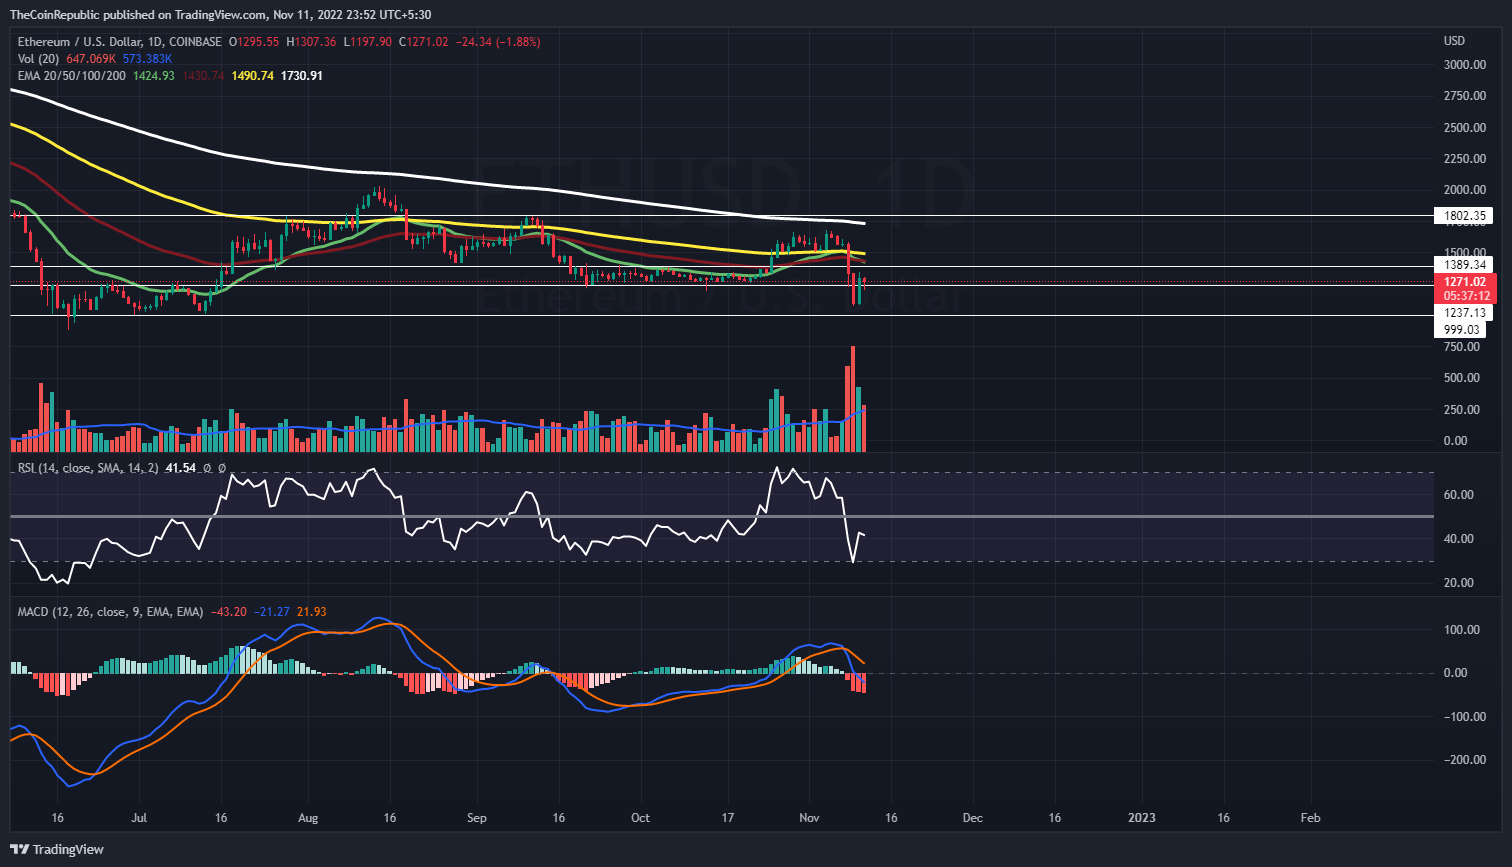
The ETH cryptocurrency needs to gather buyers in order to move closer to the higher trendline and make a breakout. ETH investors need to keep an eye on the daily price chart for any changes in trend. The momentum of the ETH coin’s downward trend is shown by technical indicators.
Relative Strength Index shows the sideways movement of the ETH coin. At 41, the RSI is directly below the neutrality. The ETH coin’s bearish momentum may be seen on the MACD. The MACD line and the signal line are about to cross negatively.
Conclusion
The cost of ethereum has significantly dropped during the past two trading sessions. The ETH cryptocurrency’s daily price chart reveals some intriguing trading patterns. To change the tug-of-war between the bulls and bears, bulls must drastically boost their accumulation, and ETH must experience purchasers rather than sellers during the intraday trading session. The momentum of the ETH coin’s downward trend is shown by technical indicators. The ETH coin’s bearish momentum may be seen on the MACD. The MACD line and the signal line are about to cross negatively.
Technical Levels
Support Levels: $1080 and $1000
Resistance Levels: $1500 and $1800
Disclaimer
The views and opinions stated by the author, or any people named in this article, are for informational ideas only, and they do not establish the financial, investment, or other advice. Investing in or trading crypto assets comes with a risk of financial loss.