Bulls could not withstand the bears' pressure and all top 10 coins have come back to the red zone.
ETH/USD
Ethereum (ETH) has followed the decline of Bitcoin (BTC), going down by 8%.
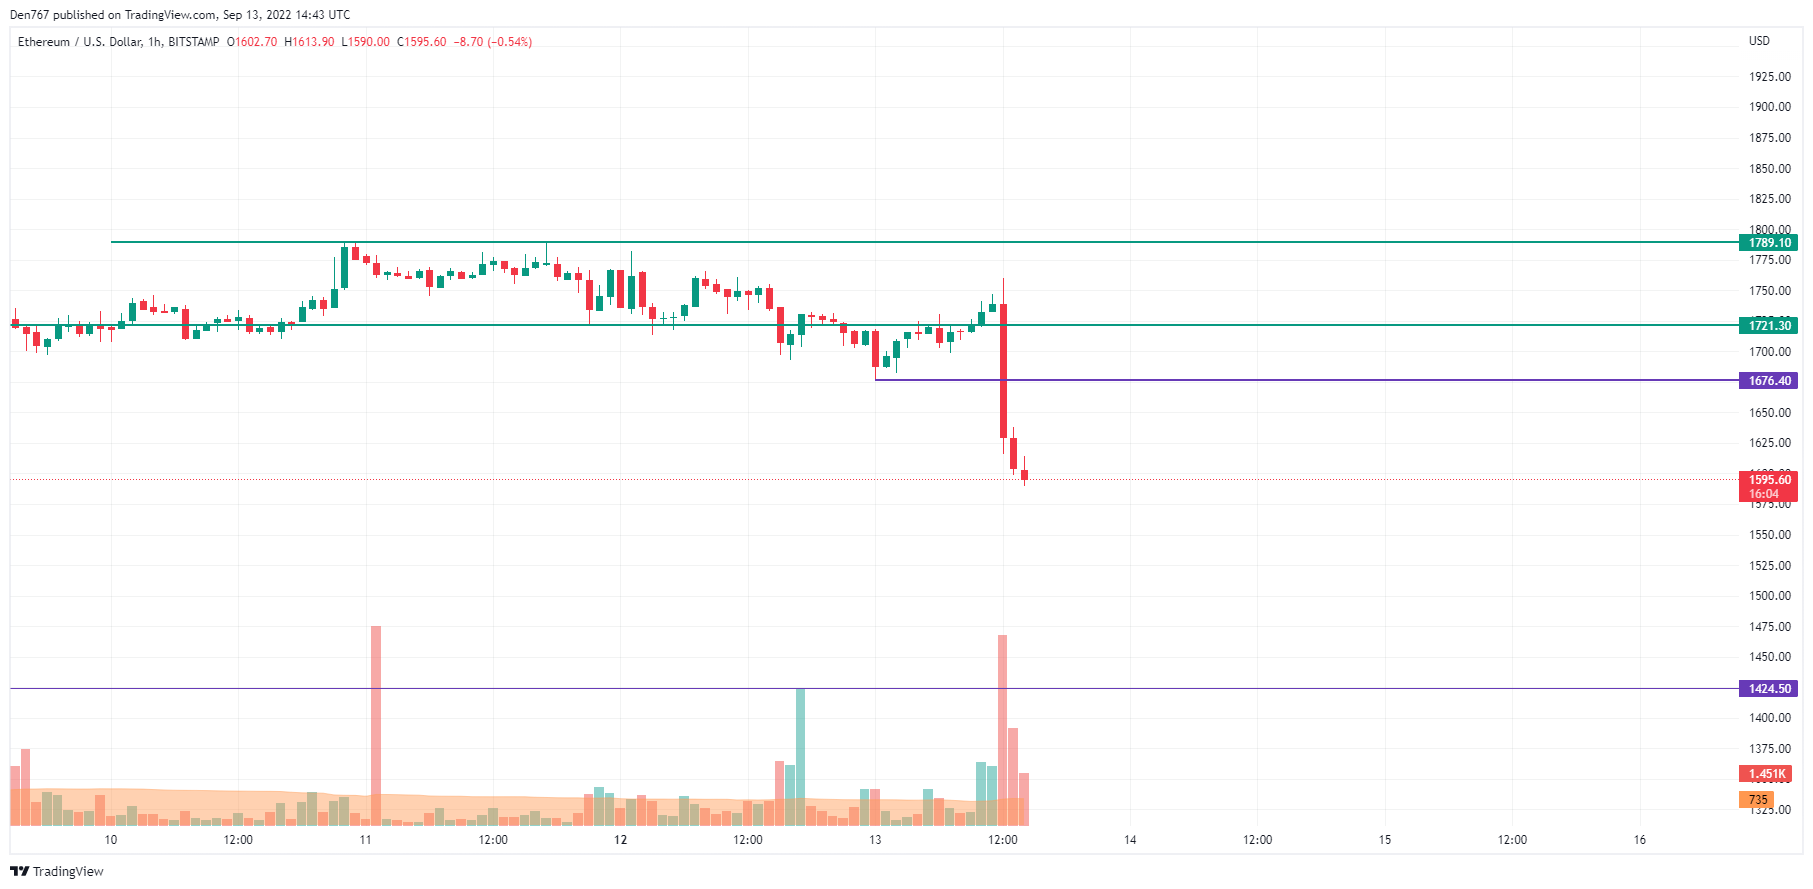
On the local chart, the rate of Ethereum (ETH) keeps declining after the breakout of the support level at $1.676. Until the price is below that mark, one should not expect further growth. Thus, the selling volume is high which means that there are high chances to see a more profound decrease.
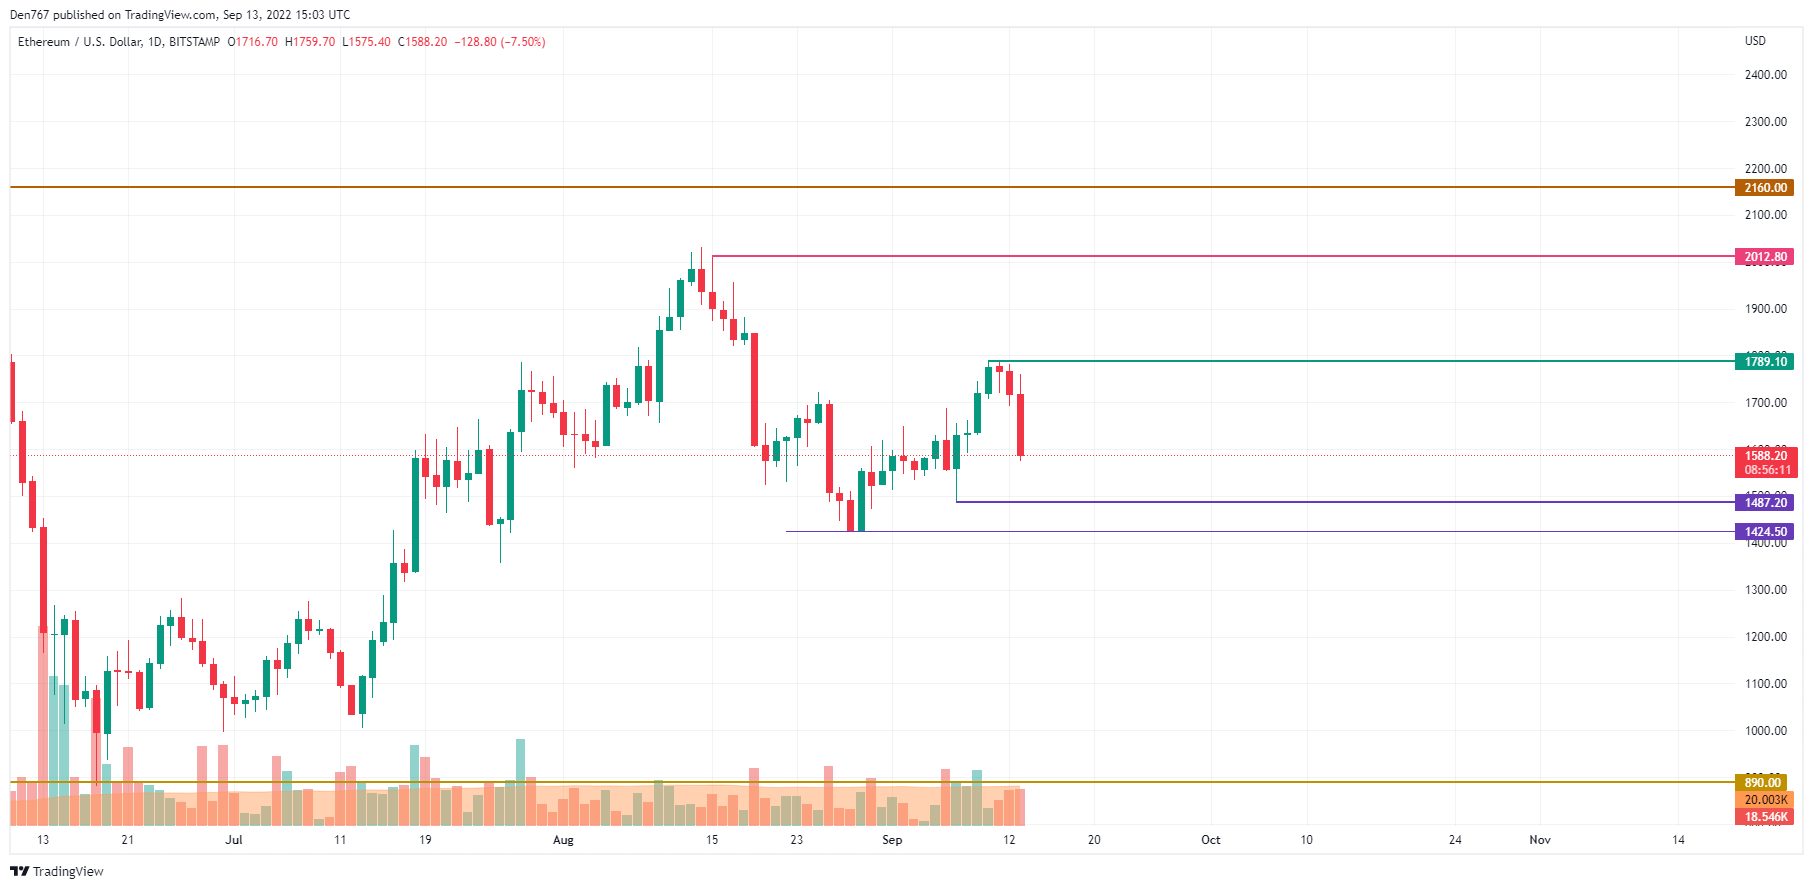
Ethereum (ETH) is on the way to the support level on the daily time frame at $1,487. However, if buyers can keep the rate of the main altcoin above $1,500 until the end of the day, traders can expect the local bounce back.
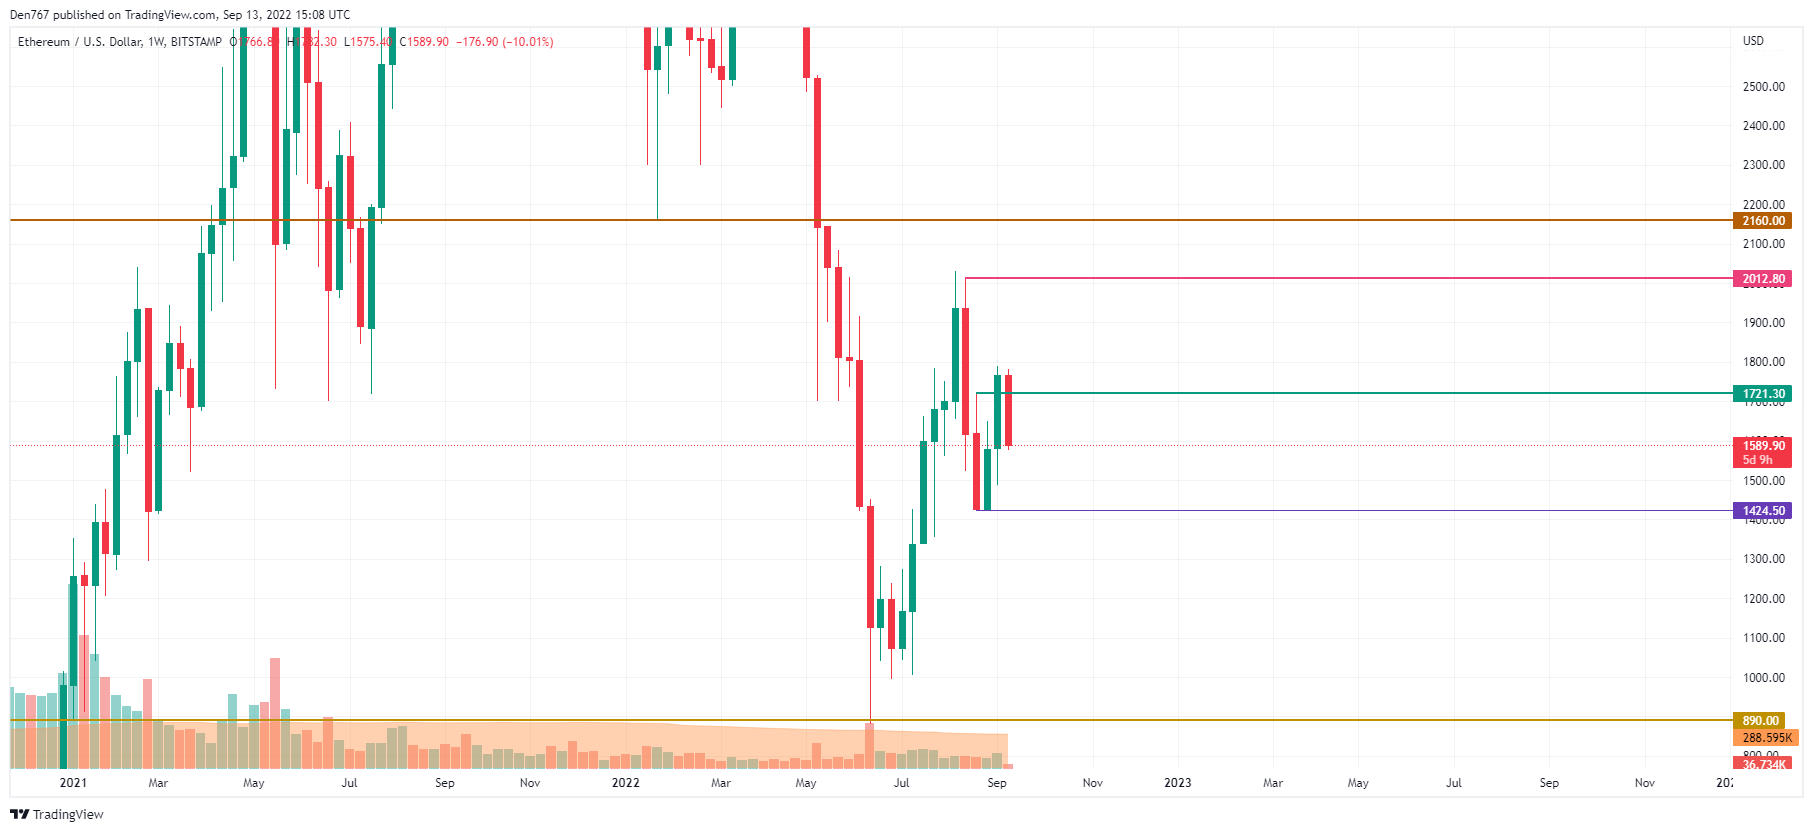
From the mid-term point of view, today's sharp drop might cancel the further growth, however, one needs to wait until the candle closes. If nothing changes, there is a possibility to see the test of the $1,424 mark.
Ethereum is trading at $1,594 at press time.