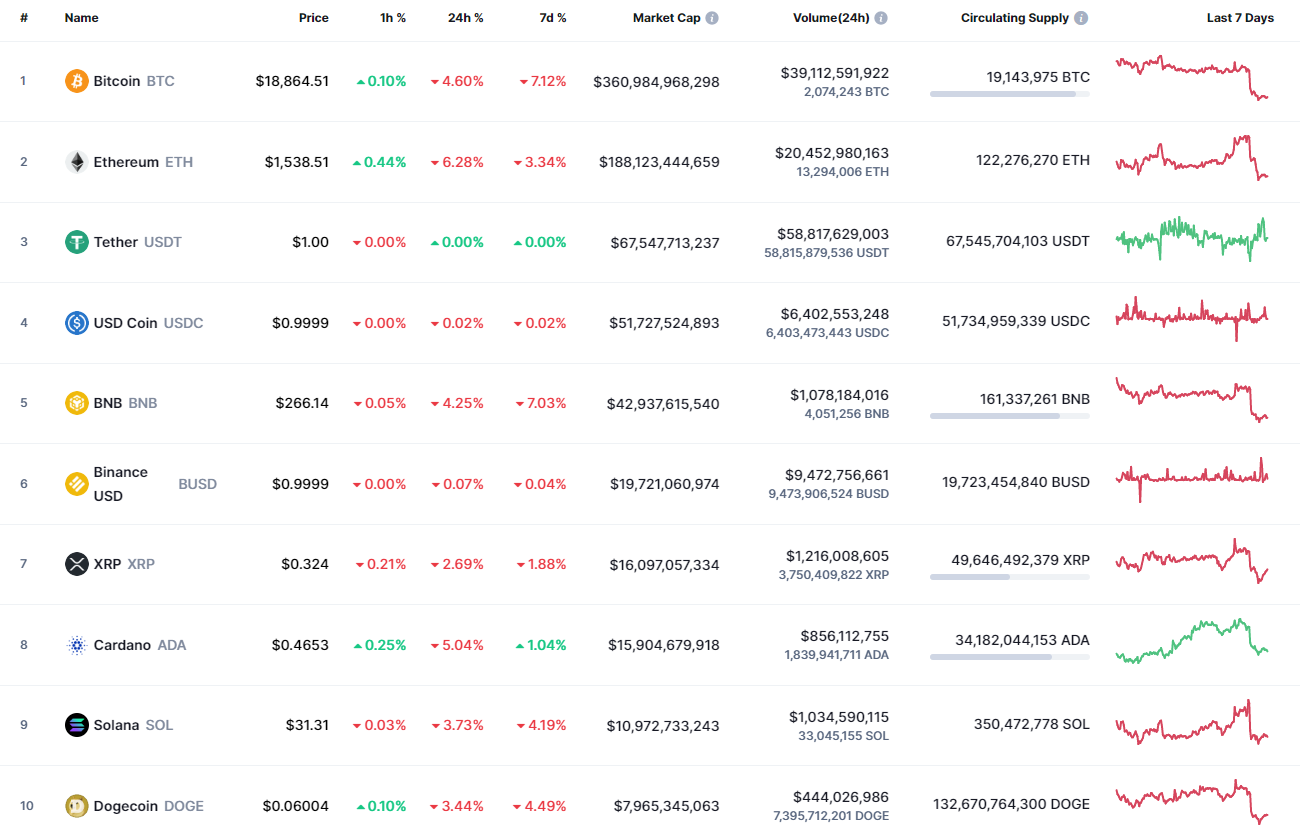
Bears are back in the game as the majority of the coins are red again.
ETH/USD
Ethereum (ETH) has turned out to be more bearish than Bitcoin (BTC), going down by 7%.
ETH/USD chart by TradingView" src="https://cnews24.ru/uploads/3dd/3dd570b01fdf90a5d910b825a9fecc3eedb970ba.png" size="1818x885">
On the hourly chart, Ethereum (ETH) has successfully broken the local resistance level at $1,537, which means that bulls have chances for short-term growth. If the volume remains on the same level or keeps rising, the upward move may continue to the $1,580 mark.
ETH/USD chart by TradingView" src="https://cnews24.ru/uploads/cf8/cf8a38bb4f22c9f57d69ee5a8e4fd85aef1f47df.png" size="1818x875">
On the bigger time frame, the situation is not so clear. The rate is stuck in the middle of the channel after yesterday's sharp drop. Traders can consider a bull run only if the price comes back to the level of $1,650, formed by the false breakout.
ETH/USD chart by TradingView" src="https://cnews24.ru/uploads/d3b/d3b4776aa440bbb8902db063da0182839061e3e8.png" size="1818x875">
On the weekly chart, nothing crucial has happened so far as the price has not left the border of the channel. However, if the drop continues to the $1,450 mark, one can see the breakout of the support level at $1,424 soon. Such a scenario is relevant until the end of September.
Ethereum is trading at $1,548 at press time.