The primary cryptocurrency has slightly recovered in the last few days and was able to reclaim the $20K level. This area is the previous 2017 ATH and acts as a psychologically significant support price level, which can potentially trigger a short-term relief rally.
Technical and on-chain analysis by Shayan
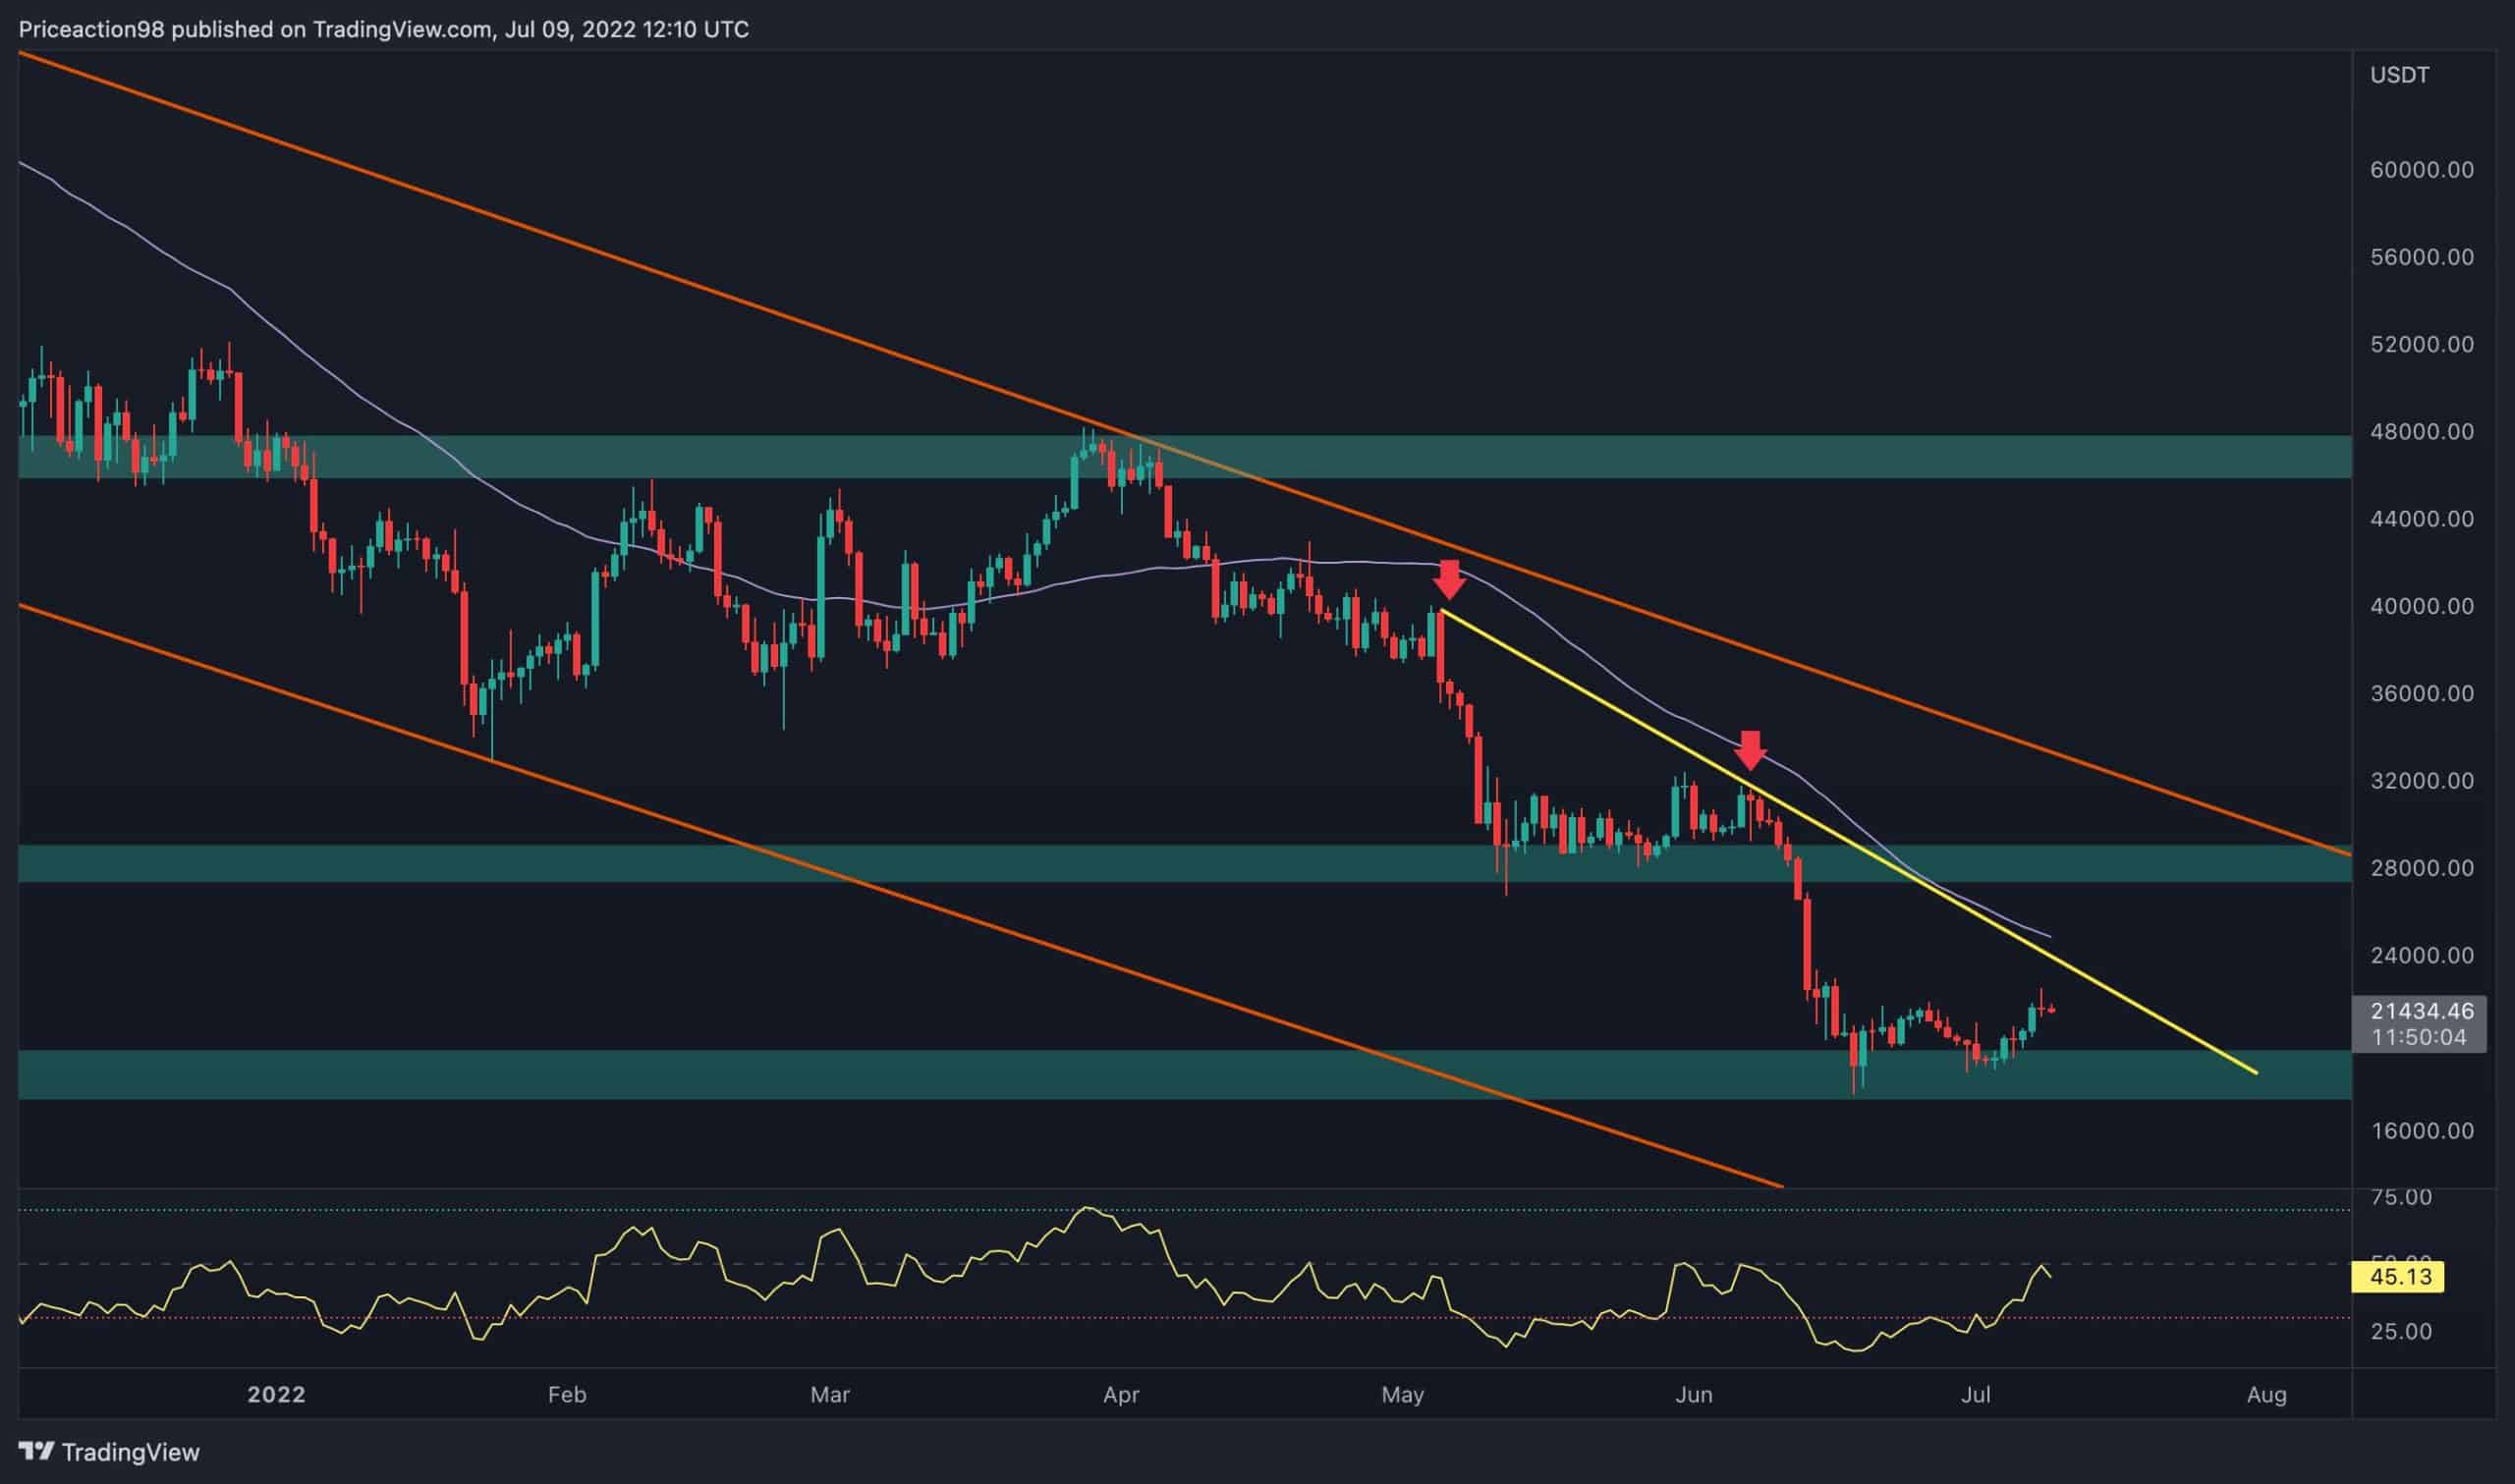
The Daily Chart
Bitcoin has been forming lower lows and lower highs during the past few months, which can be witnessed by the following mid-term yellow descending trendline. The trendline has rejected the price twice (marked by red arrows) and initiated a new bearish leg. The price has to break above the trendline to then aim for the long-term descending channel’s upper boundary, marked orange.
In addition, the 50-day and 100-day moving average lines, alongside the long-term channel’s upper trendline, are the main obstacles in Bitcoin’s path to a new all-time high.
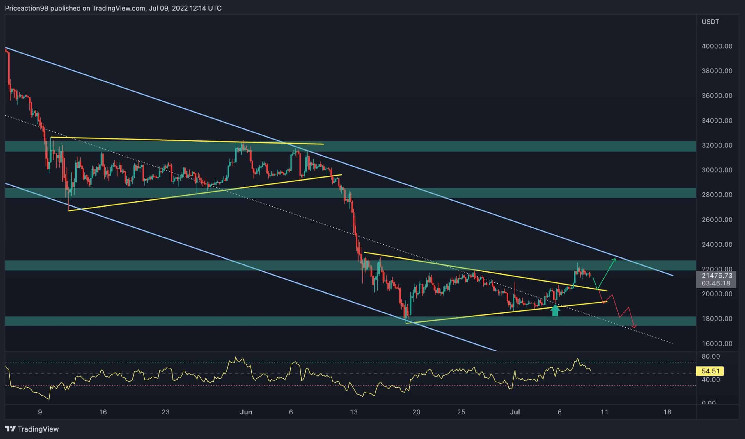
The 4-Hour Chart
After breaking the blue channel’s middle threshold, the price formed a bullish leg as a confirmation of the breakout (marked by a green arrow) and surged to the triangle’s upper boundary. This jump accompanied a significant bullish momentum resulting in a breakout of the decisive triangle pattern.
As mentioned in our most recent analysis, the triangle pattern could turn into a continuation or a reversal pattern, depending on the direction the price breaks out. Given that the price has broken the triangle to the upside, a short-term pullback to the triangle’s upper boundary and a new rally to the $28K is the possible scenario for Bitcoin.
However, we should always consider the option of a bull trap, where the price gets rejected from this range and plummet to re-test the $17K-$20K critical zone. If the price breaks below the current 2022 low of $17K – a steep crash towards the $15K mark would be inevitable.
On-chain Analysis
The following chart demonstrates Bitcoin’s realized cap alongside its market cap. Realized Capitalization measures the aggregate USD value of all coins when transferred. In contrast, Market Capitalization measures the asset’s current valuation by multiplying the total supply and its USD price.
Historically, bear market bottoms had formed when Bitcoin’s Market Cap crossed under its Realized Cap. The mentioned cross signifies a lifetime investment opportunity as the entire market on aggregate goes into an unrealized loss territory which happens extremely rarely.
As shown on the following chart, Bitcoin’s Market Cap has already plunged below the Realized Cap, indicating the beginning of its final capitulation phase and possibly the bottom of this bear market.
