Bitcoin (BTC) has closed below the 200 Weekly Moving Average (WMA) as its price continued to fall over the last 24 hours.
The largest crypto by market cap, BTC, breached a critical area of support over the last 24 hours as it dipped below the $19,000 level. Since then, BTC’s price has recovered to close June off at $19,925. This positions BTC’s price below the 200 WMA, which is the first time in the token’s history. Furthermore, BTC posted the lowest Relative Strength Index (RSI) ever.
At the time of writing, BTC’s price now stands at $19,392.22, according to crypto market tracker CoinMarketCap. This comes after a 3.02% drop in price over the last 24 hours and a 7.91% drop in price over the last seven days. Due to the drop in BTC’s price, its total market cap is now $370,041,403,137.
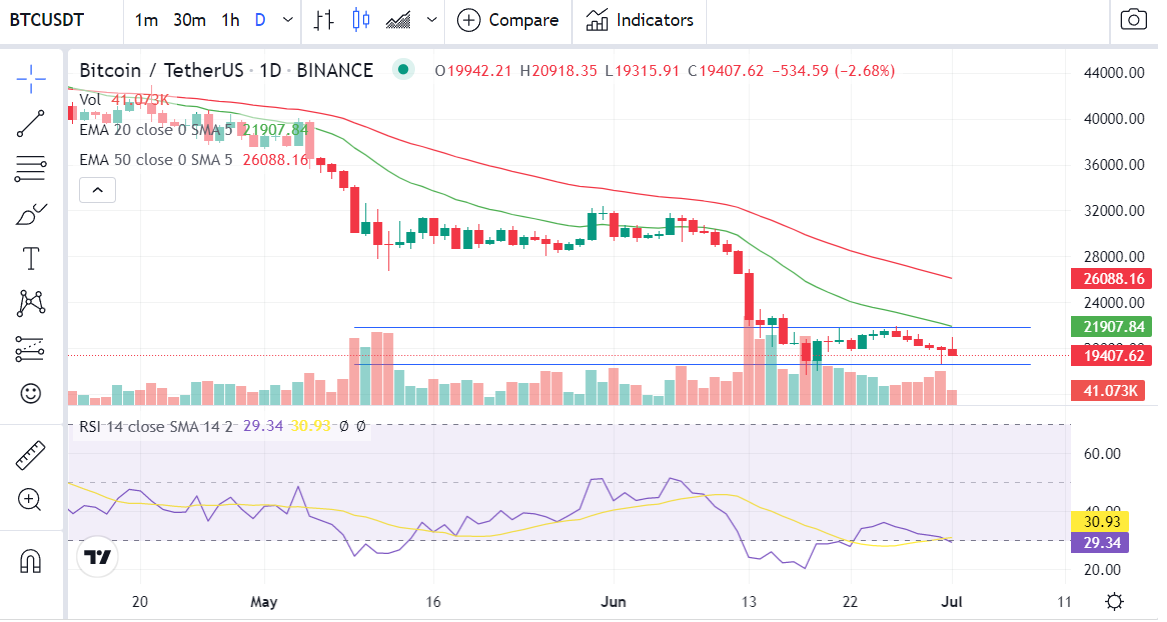
Looking at the daily chart for BTC/USDT, the RSI line has crossed below the RSI SMA line to signal a bearish flag. In addition to the two lines crossing over the last day, the RSI on the daily chart is now at 29.34, taking BTC into oversold territory.
BTC is currently at a price channel with the upper bound at $21,876 and the lower bound of the channel at $18,605. A descending triangle chart pattern has also formed on the daily chart for BTC as its price continued its downwards move to post another red daily candle.
BTC may drop as low as the lower bound of the price channel as it approaches the apex of the chart pattern.
Disclaimer: The views and opinions expressed in this article are solely the author’s and do not necessarily reflect the views of CQ. No information in this article should be interpreted as investment advice. CQ encourages all users to do their own research before investing in cryptocurrencies.