Be[in]Crypto takes a look at on-chain indicators for bitcoin (BTC), more specifically the Stablecoin Supply Ratio (SSR) in order to draw comparisons with previous market bottoms.
SSR is an on-chain indicator that shows the ratio between the supply of bitcoin (BTC) and the total supply of stablecoins. So, the indicator moves when there is a change in either the price of BTC or the supply of stablecoins.
A low value indicates that a large portion of the entire bitcoin supply can be bought with stablecoins. More specifically, an SSR reading of 10 indicates that 10% (1/10) of the BTC supply can be bought with stablecoins.
SSR gives buying signal
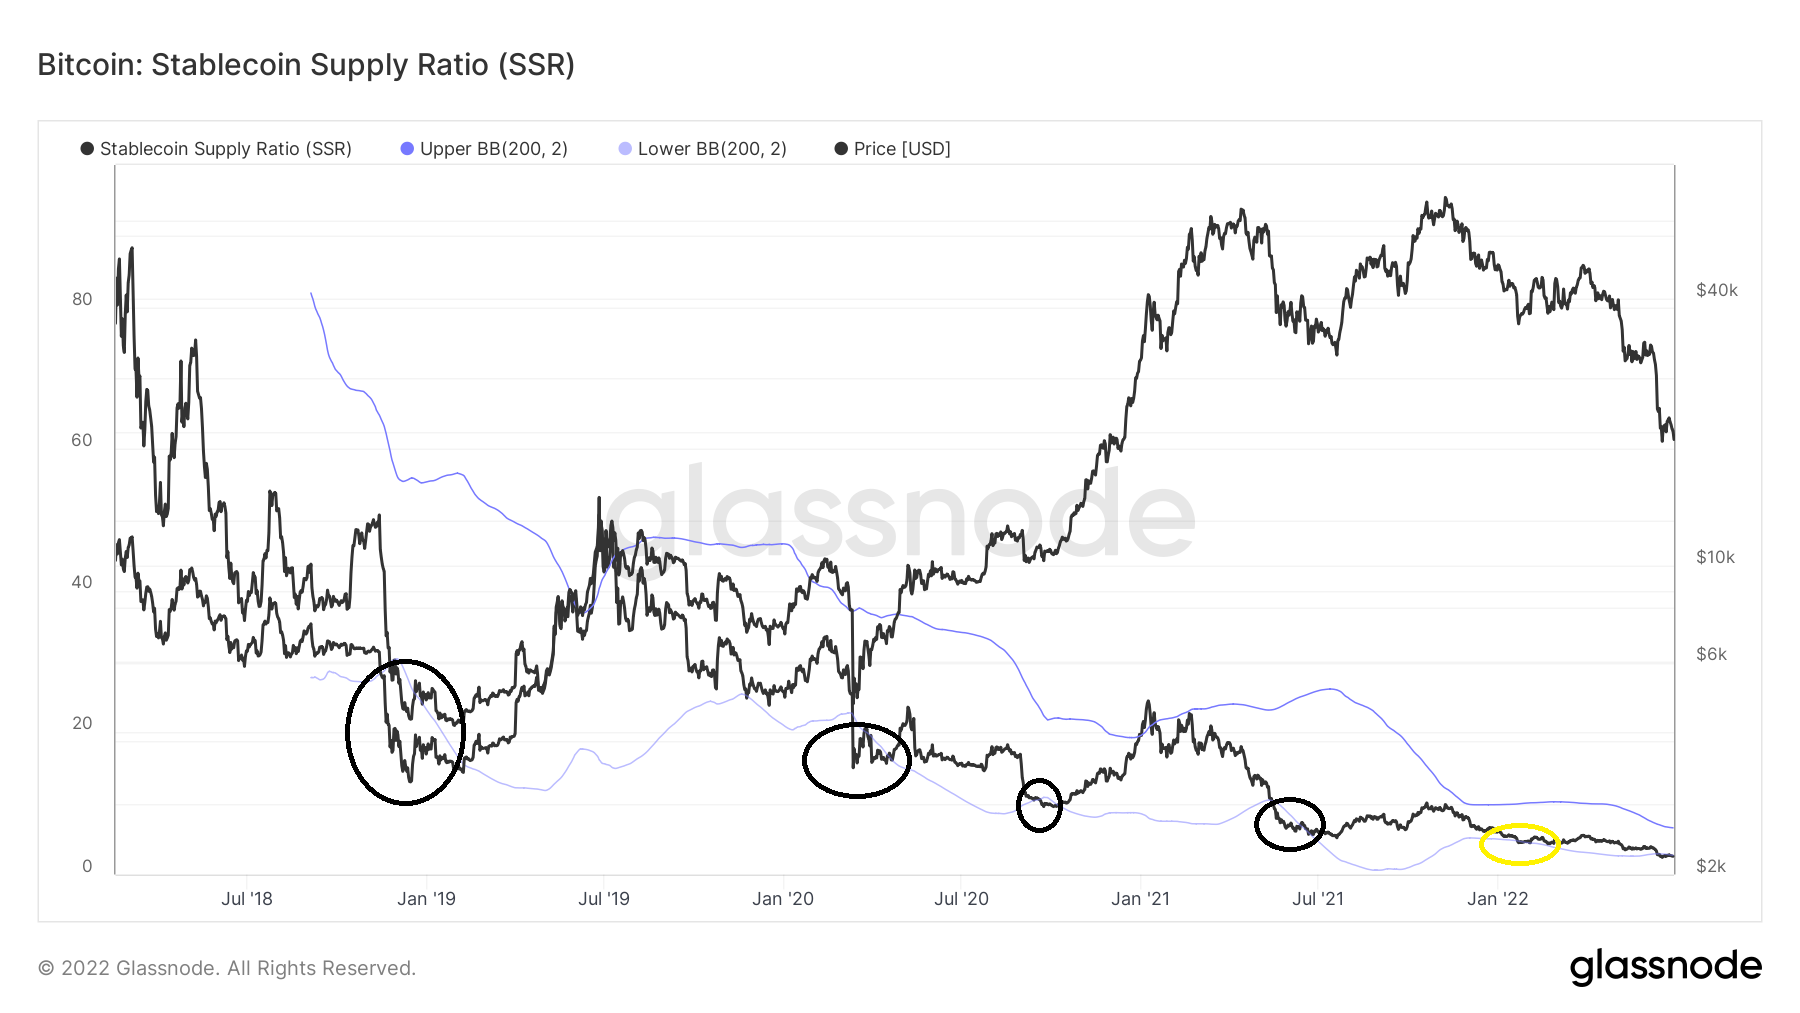
Historically, a buy signal has been given whenever SSR falls below the lower Bollinger band (black circle). The Bollinger bands measure deviations from the norm. So, a decrease below the lower band indicates that the decrease has been larger than usual.
This suggests that the indicator has decreased significantly more than it usually does.
So far, there have been four large such deviations (black), and one smaller one (yellow). The four large ones led to significant upward movements, while the one on Feb (yellow) led to a much smaller increase.
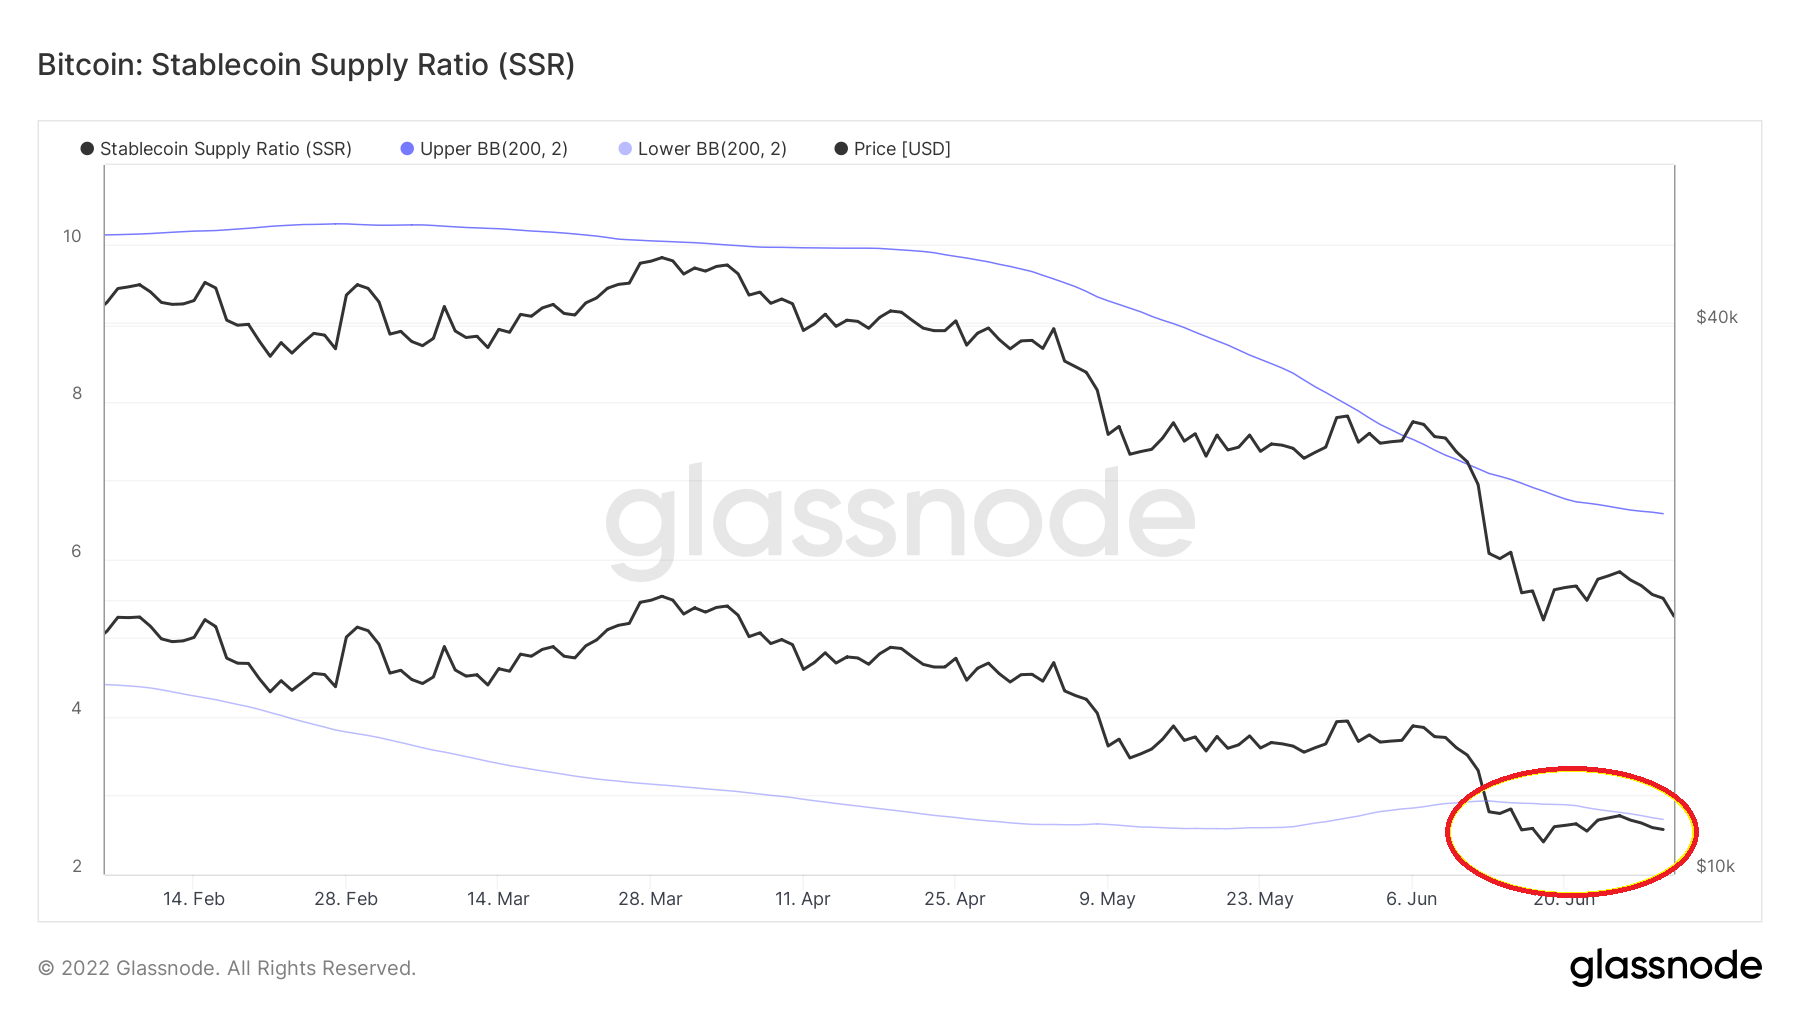
Currently, SSR has been trading below the lower Bollinger band since June 13 (red circle). So, it has been doing so for 17 days. During this time, it also reached a new all-time low of 2.4. This means that 41.6% of the entire BTC supply (1/2.4) can be bought with stablecoins.
When compared to the previous such deviations, based on its length and momentum, the current deviation would be expected to initiate a considerable price increase.
Comparison to previous cycles
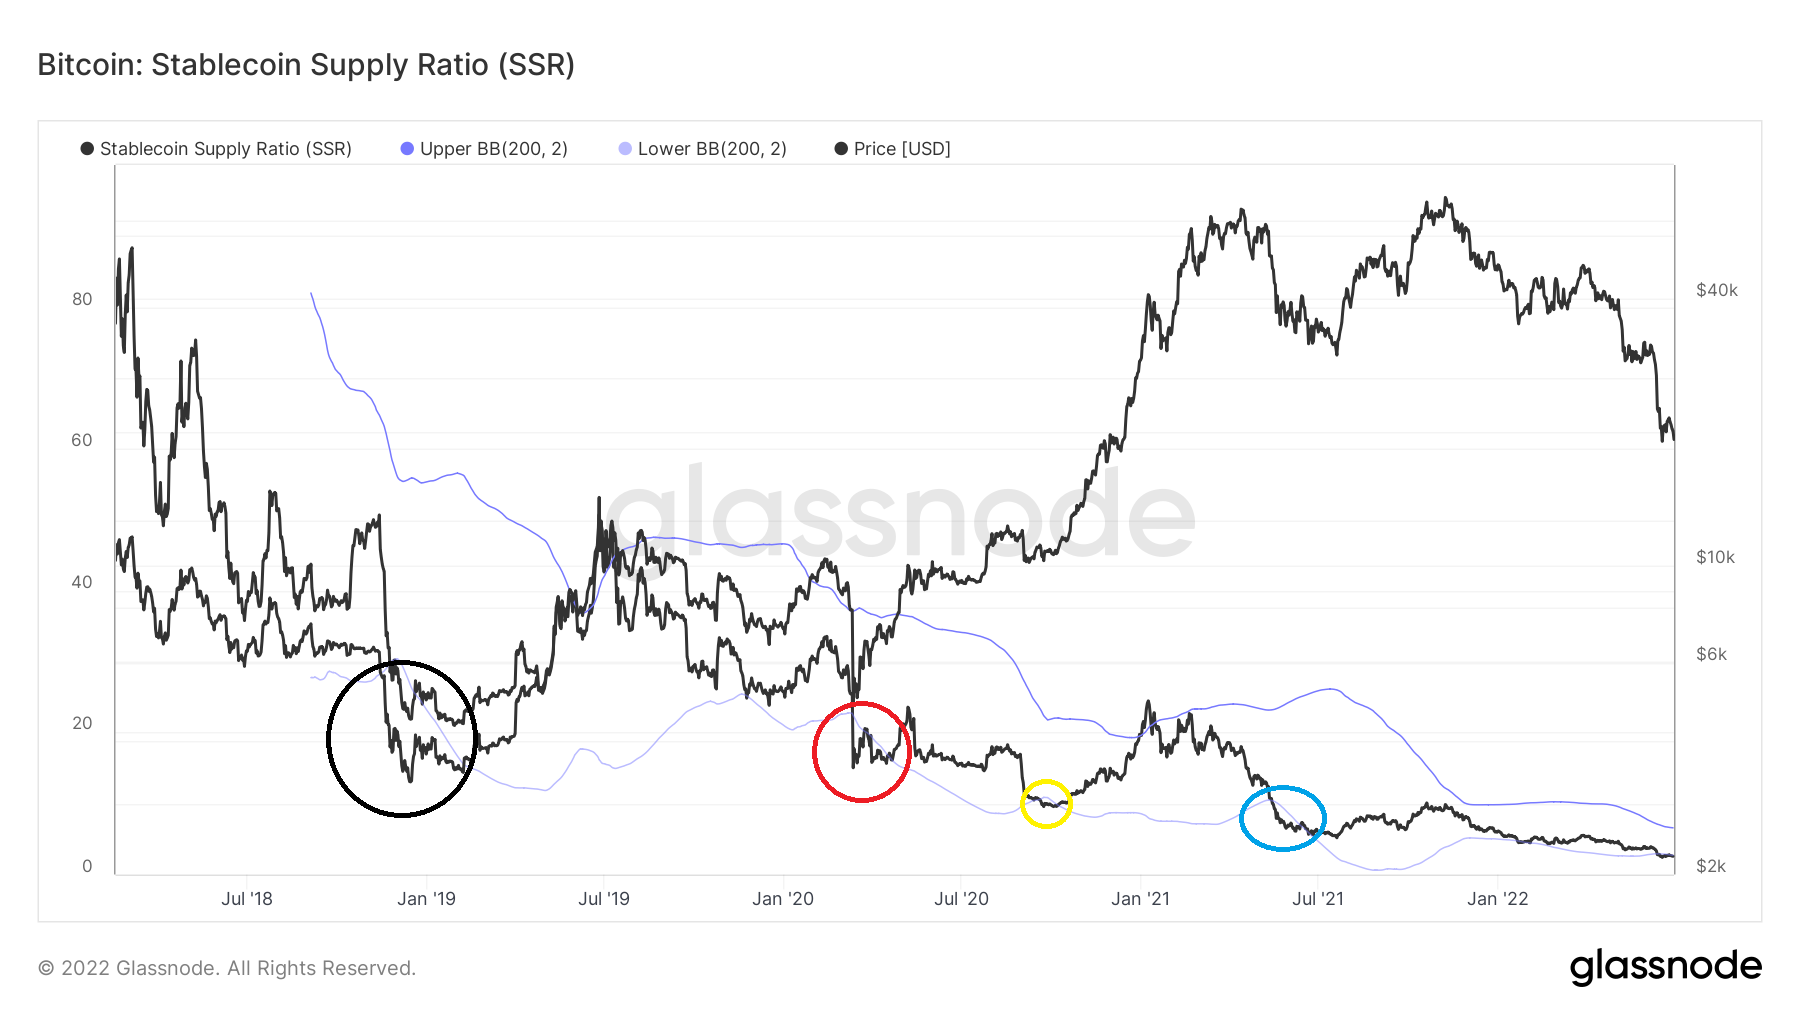
The first deviation (black) occurred between Nov 2018 and Feb 2021. It lasted for 84 days. At its most extreme, the difference between the lower Bollinger band (26) and the SSR (21) was five.
The second deviation (red) was shorter, lasting for 39 days between March and April 2020. However, it was more extreme, since at its lowest point the difference between the lower Bollinger band (22) and the SSR (15) was seven.
The third deviation (yellow) lasted for a similar period of time (37 days), but was much less extreme, since the difference between the Bollinger band and the indicator was only 1.5.
The fourth deviation (blue) lasted for exactly 30 days, and the difference between the lower Bollinger band and SSR was 2.5.
The current deviation has been going on for 17 days. So far, the biggest deviation has only been 0.5, but that is to be expected due to the fact that the indicator was at a new all-time low of 2.4.
So, according to previous history, the indicator will reverse after a maximum of 24 days. Since the BTC price bottoms have usually been reached in the beginning of the deviation, it is possible that a bottom is already in place.
For Be[in]Crypto’s latest bitcoin (BTC) analysis,click here