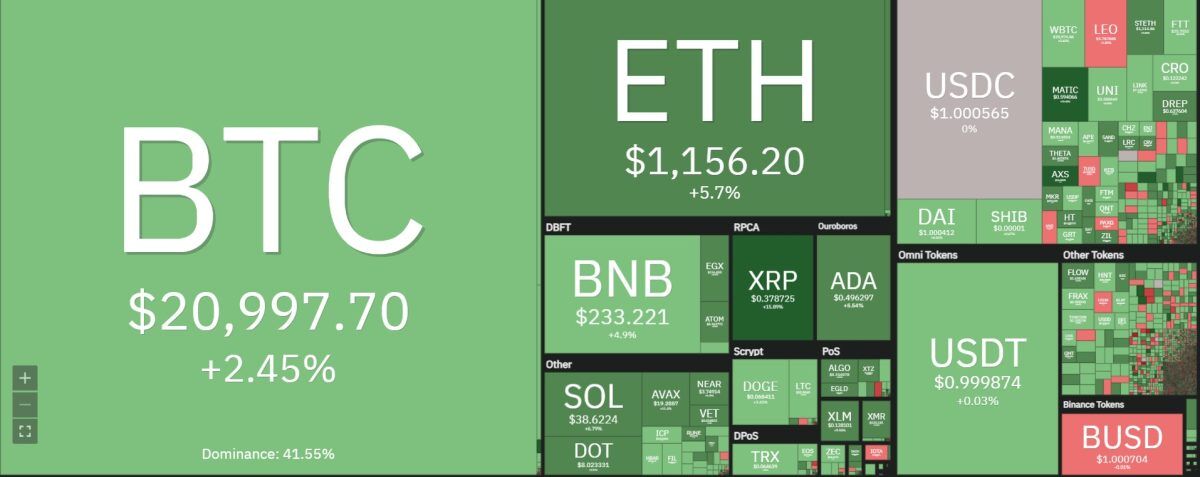
Bitcoin price analysis is getting really confusing as the market is torn between a potential bottom or macro fundamentals. However, minor bounce in the price seems to be a stopover for the bears as they seek to establish a bull trap. The psychological barrier at $20,000 isn’t inspiring much confidence into the bull camp.
Currently, the bulls are stagnating near the $21,900 level as the US stock market is recovering from the Fed rate cut. The global markets are staging a rebound and rounds of recovery are causing minor bounce in the asset prices. However, altcoins are not expected to bounce back sooner. Bitcoin sellers seem to be in a exhaustion mode since the technical indicators are deep in the red and the show signs of reversal on the hourly charts.
Bitcoin price analysis on the 24-hours chart: Bulls ready to cross the $21,500 mark

As Bitcoin price analysis shows, the price is hovering near the $21,000 resistance. Yesterday’s bullish candles are a precursor to the small upcoming bounce in the price. The bearish exhaustion will likely sweep the market with a wave of bullish pressure which will likely take the price towards $21,500 psychological mark on the hourly charts.
Yesterday’s 7% downswing ensured that the daily price has a floor near $19,400 level. Buyers have the opportunity to ride the wave and create small profits on the daily charts. Bitcoin price analysis shows a concrete failure can see the price move towards $17,000 floor as the market forces are still definitely bearish.
4-hour BTC/USD chart: Bitcoin all set for minor bullish wave
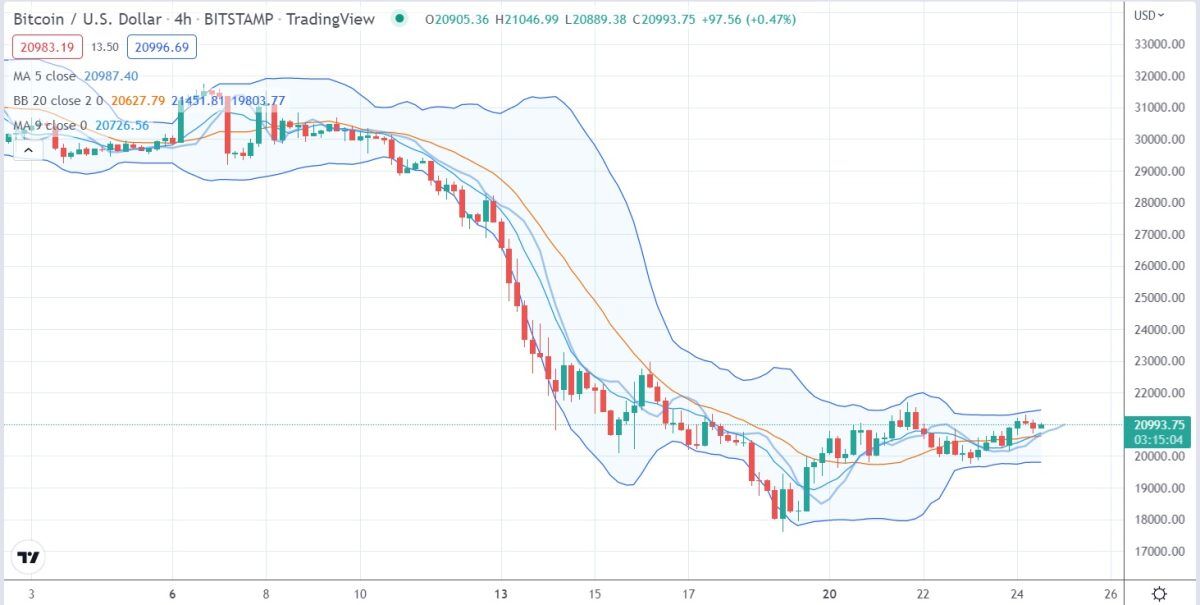
The 4-hour chart is showing an ascending channel leading all the way up to $21,000 mark. The 20k support area has multiple buy orders and a possible rebound is around the corner. A bullish reversal will certainly inspire confidence in the hourly traders to take small bets. It will also help relieve the oversold technical indicators.
The bullish divergence on the RSI technical indicator is showing minor strength as per Bitcoin price analysis. The diverging Bollinger Bands are also showing signs of a breakout since the price is moving in an ascending price channel towards the $21,280 resistance on the hourly charts. If the price does not break above the channel to reach the $21,500 zone, the traders will likely switch to aggravated selling which will push the price towards the $17k region.
Bitcoin price analysis conclusion: BTC all set for minor bullish wave
The repeated dips towards the sub-$20,000 levels is pushing the current BTC/USD traders towards another bull trap. However, if navigated correctly, the small bounce can prove to be a good day trading opportunity. If the rebound plays out correctly, the price can touch $22,000 level briefly.
Bitcoin price analysis shows that the 20-day EMA will likely kill any ultra-bullish hopes and push the price below $24,700. Traders must not expect to reach above $25,000 level any time soon since the 50-day moving average has massive sell orders lined up to protect the bearish eco-system currently prevalent in the market.
Disclaimer. The information provided is not trading advice. Cryptopolitan.com holds no liability for any investments made based on the information provided on this page. We strongly recommend independent research and/or consultation with a qualified professional before making any investment decisions.