Bitcoin’s price has been consolidating for almost a month, as the price failed to break below or rebound from the $30K area over an extended period. This is a significant level as it has previously held the price during last year’s crash from the $64K all-time high (from April 2021), and it could support the cryptocurrency for a short-term rally once again.
Technical Analysis
By: Edris
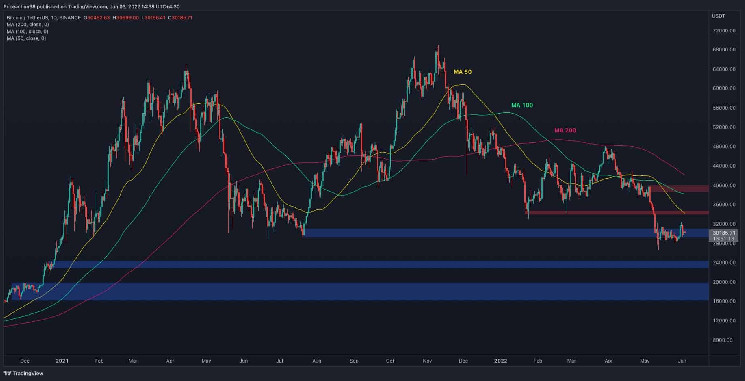
The Daily Chart
If a bullish move occurs, the 50-day moving average and the $35K zone would be the first resistance levels that could be targeted. On the other hand, if the price breaks below the current $28K-$30K support area, another impulsive bearish leg towards the $24K and eventually the $17K-$20K area is feasible. This could mark the bottom of this bear market. For the trend to be considered bullish again, the price would have to break above the 200-day moving average, which is currently around the $42K mark.
The 1-Hour Chart
On the 1-hour timeframe, the price oscillates in a tight range between $28K and $31K, hunting stop losses and trapping both bulls and bears on either side. The cryptocurrency has been forming a falling wedge while dropping to the lower boundary of the range at $28K and has even wicked below the level, stopping the bulls out and tempting the bears to open shorts on the bearish breakout.
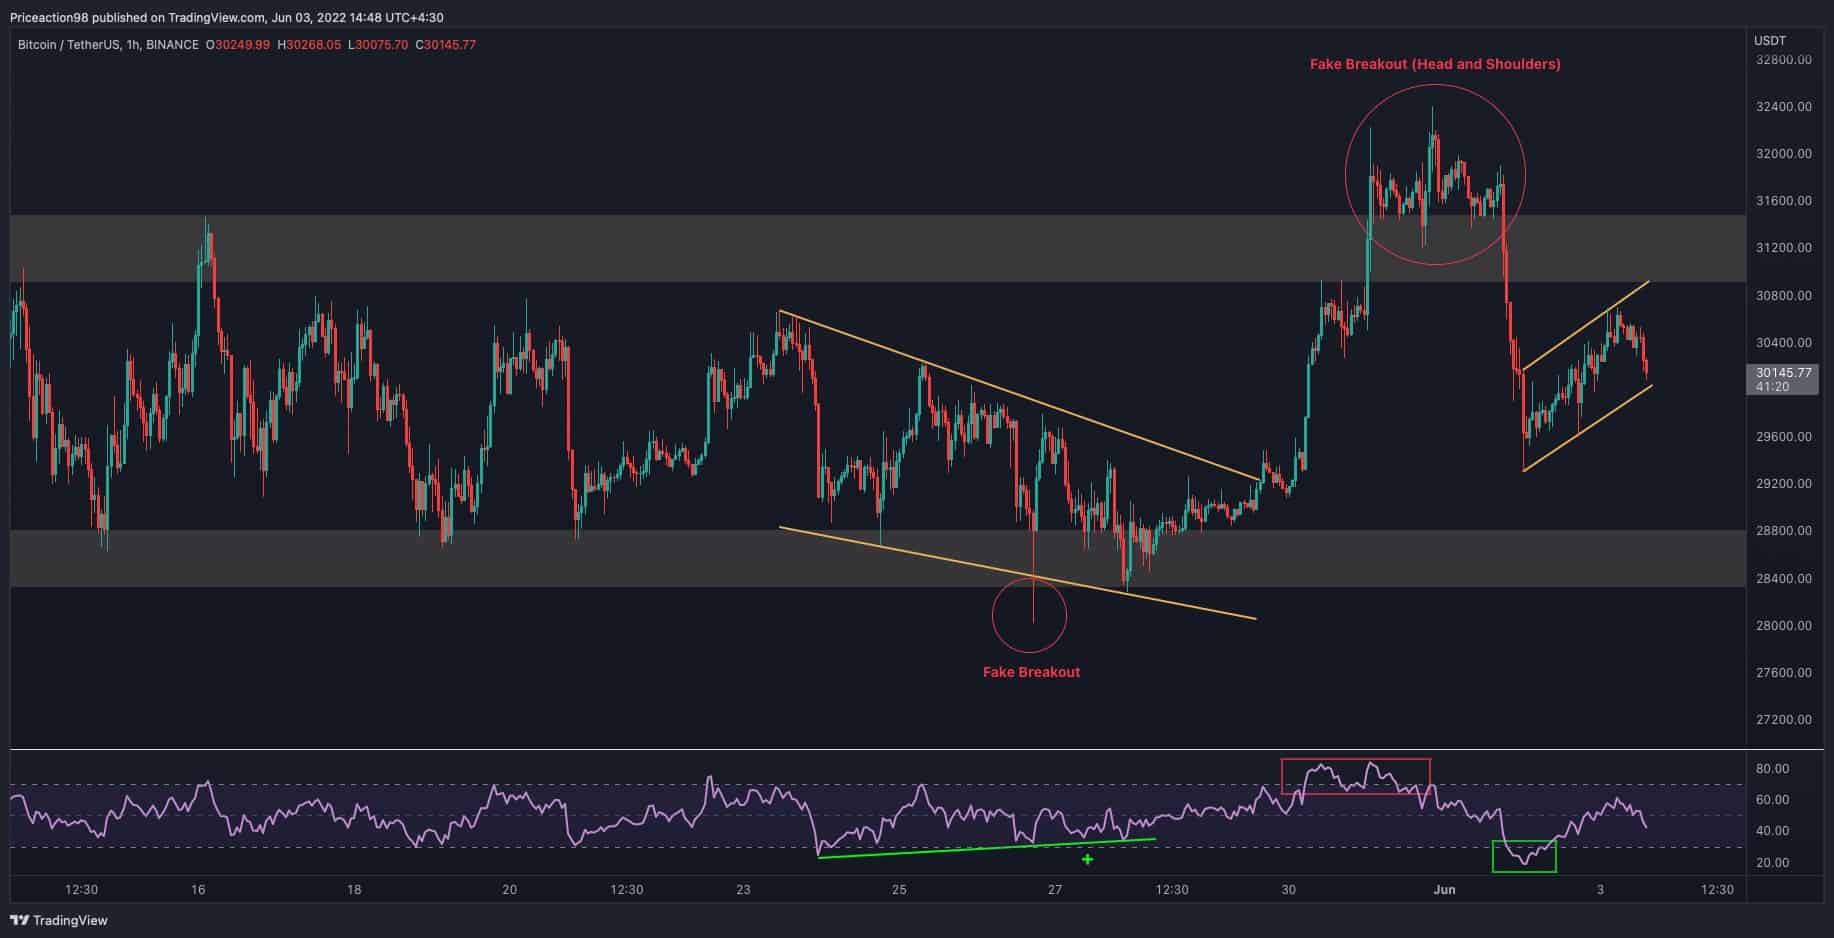
This price action turned out to be a fake breakout as the RSI indicator was signaling a bullish divergence. BTC has rebounded from $28K, breaking above the falling wedge pattern, before reversing to the downside.
Currently, the bears are in control again as the price has made an impulsive bearish move followed by a bearish flag pattern indicating heading towards the lower threshold of the range is possible. If the price finally breaks below this range, a drop to the $24K level would be expected.
On-Chain Analysis
By: Edris
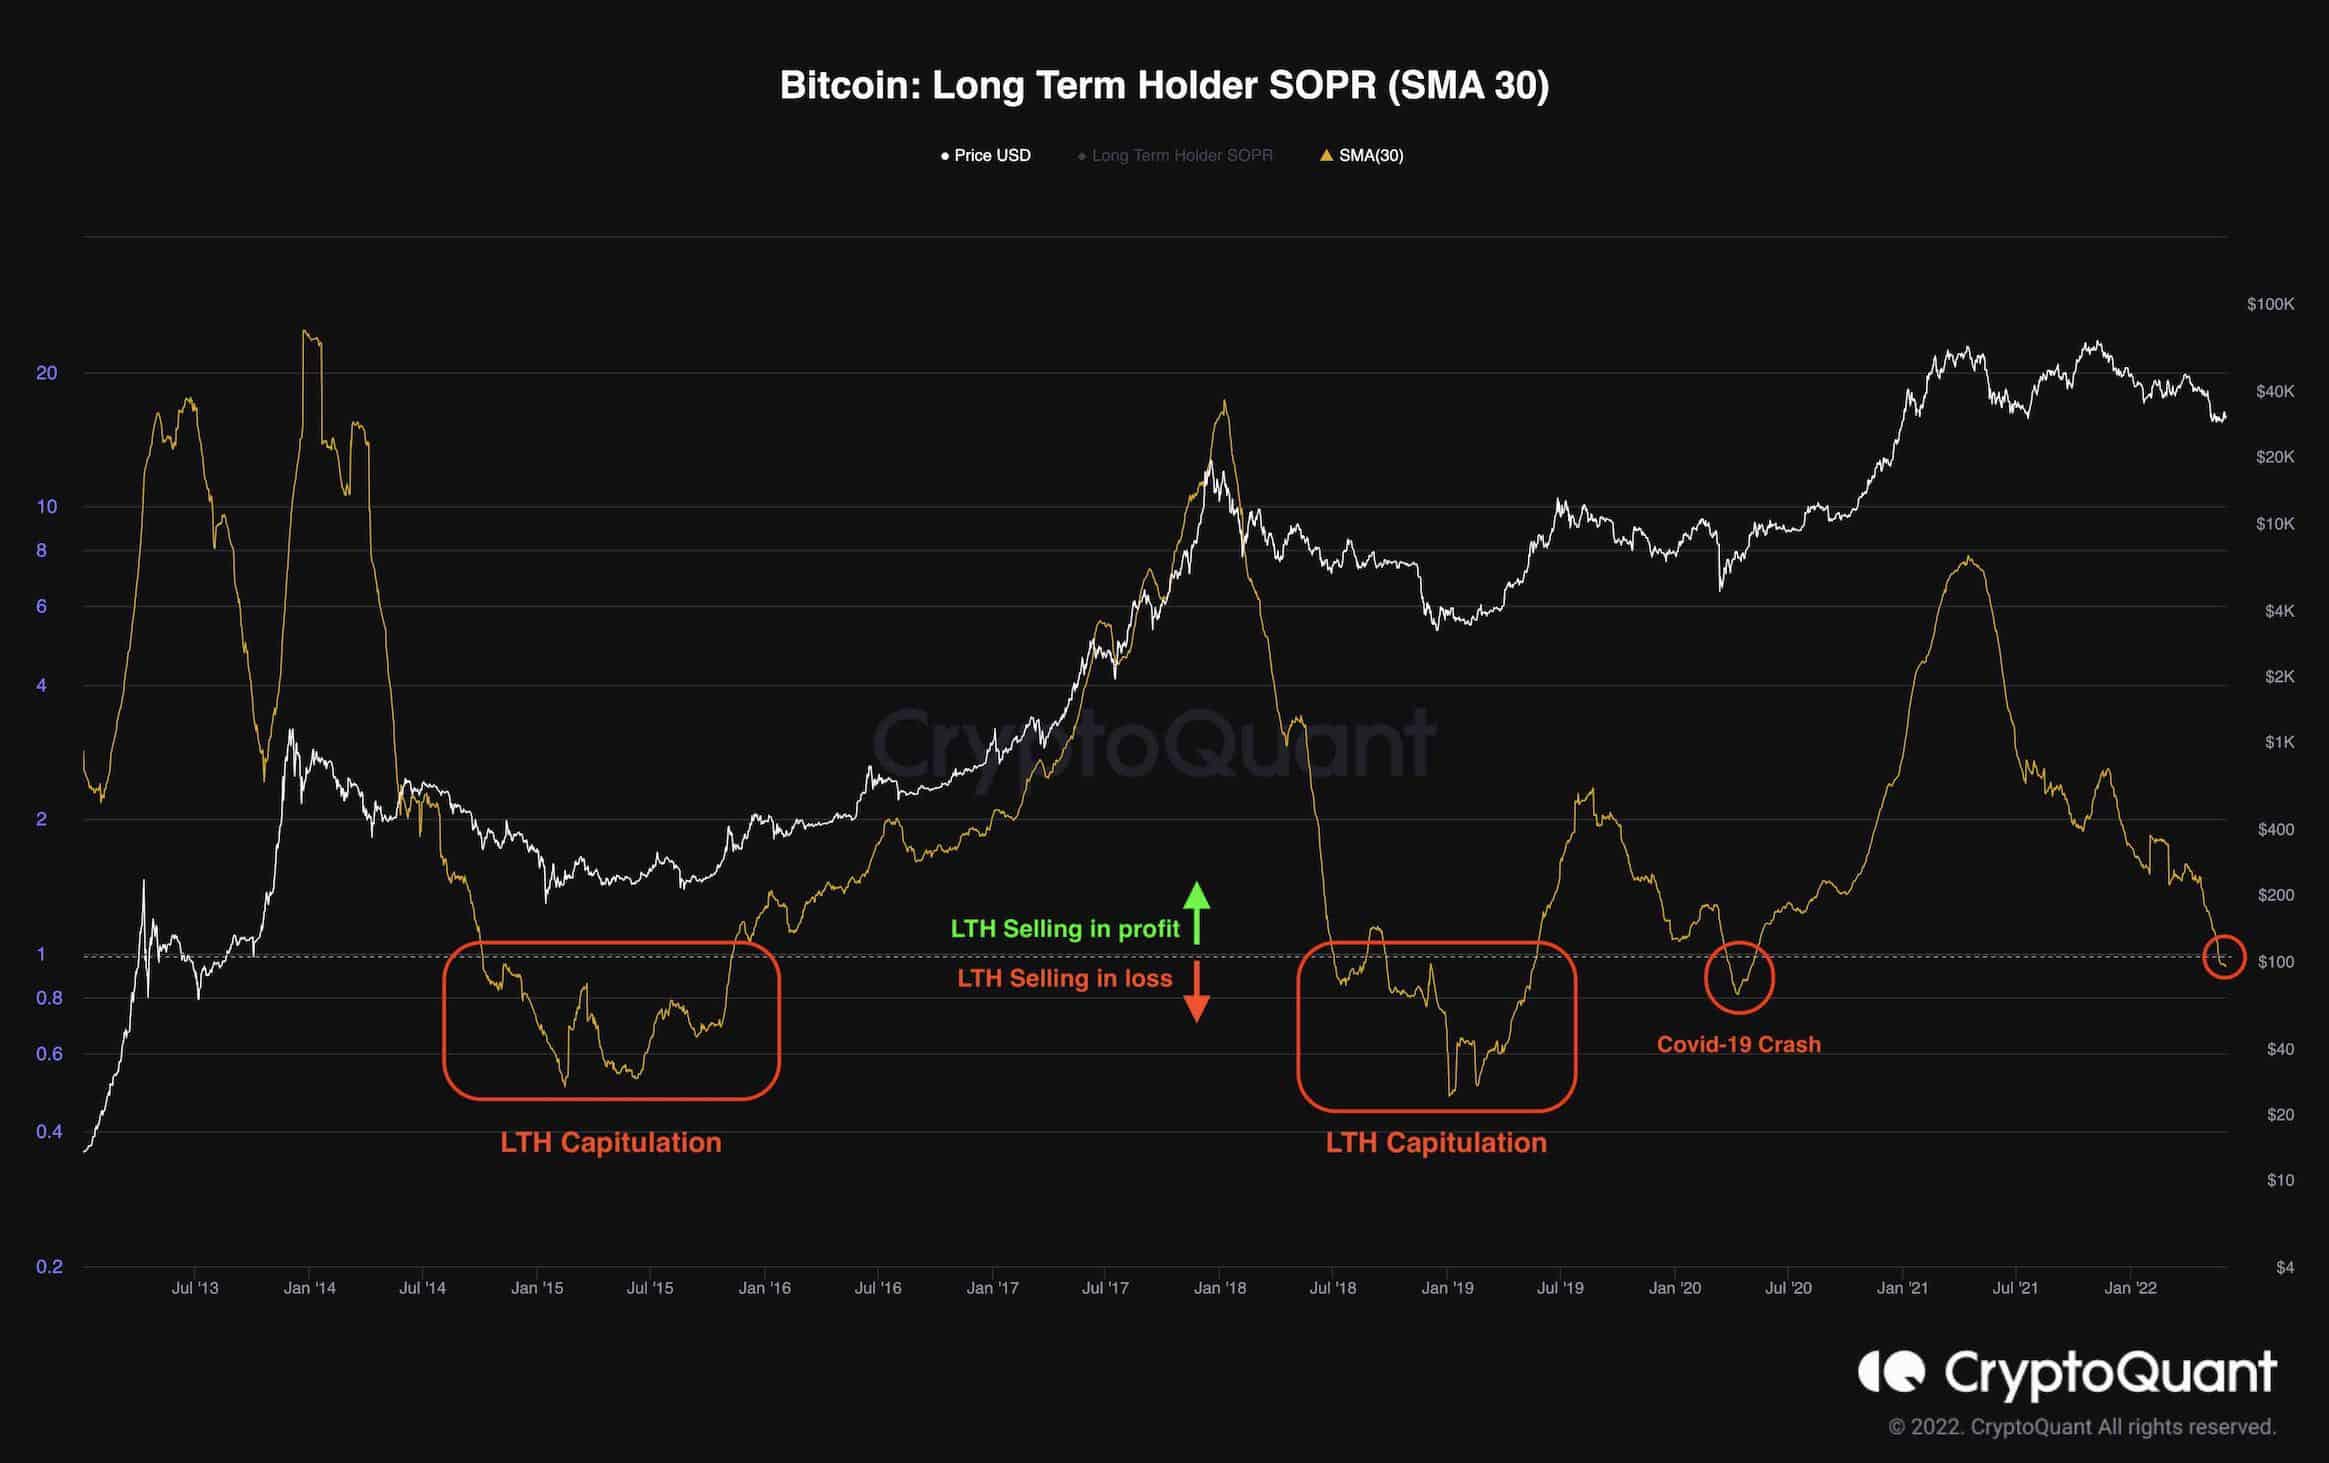
Bitcoin Long Term Holder SOPR (SMA 30)
Markets usually tend to put a bottom when massive losses are inflicted on the market participants, signaling “Capitulation.”
In the Bitcoin market, there is a lot of emphasis on the capitulation of short-term holders, as it helps to identify local bottoms in the middle of a long-term bullish trend.
However, short-term holders’ capitulation in bear markets is not a very helpful indicator as most of the supply is held by the long-term holders. A long-term holders’ capitulation phase is needed for a multi-year bottom to form.
The chart above demonstrates the long-term holders’ SOPR – a metric that measures the amount of profits/losses realized by this cohort. Values above 1 indicate profits, and below one are associated with realized losses.
It is evident that during previous bear markets, a lengthy period of long-term holders’ capitulation occurred as these participants were exiting the market at a loss. The long-term holders’ capitulation phase coincides with the Smart Money accumulation phase. Currently, the long-term holders are entering the capitulation phase. They are selling at a loss, indicating that the smart money accumulation phase has begun.