- Amid the cryptocurrency crash, the bitcoin price is stabilizing itself above $31000 by gaining a certain uptrend this week, and Bitcoin’s market dominance has also increased by 45%.
- After closing 9 consecutive blood-red candles over the weekly chart, Bitcoin price is now finally signaling some recovery.
- Bitcoin was transferring the momentum above $31000 in the past 24-hour period after being oversold for weeks. Bitcoin started the week from $29000 level and surged to $31949 yesterday, signifying the return of buyers into the market.
Cryptocurrency market has gone through a very tough time in the last few months. Meanwhile, Bitcoin(BTC) closed each weekly candle from the last few months under high selling pressure, and Bitcoin whales were trapped under the circumstances of a bear market. However, now Bitcoin has started this week’s candle by gaining around 11% and is still gaining over the weekly chart. BTC broke out of the long-term consolidation phase and has recovered above it; now BTC price is trying to sustain above the $31000 level, and small whales are playing a significant role in maintaining BTC above the consolidation area.
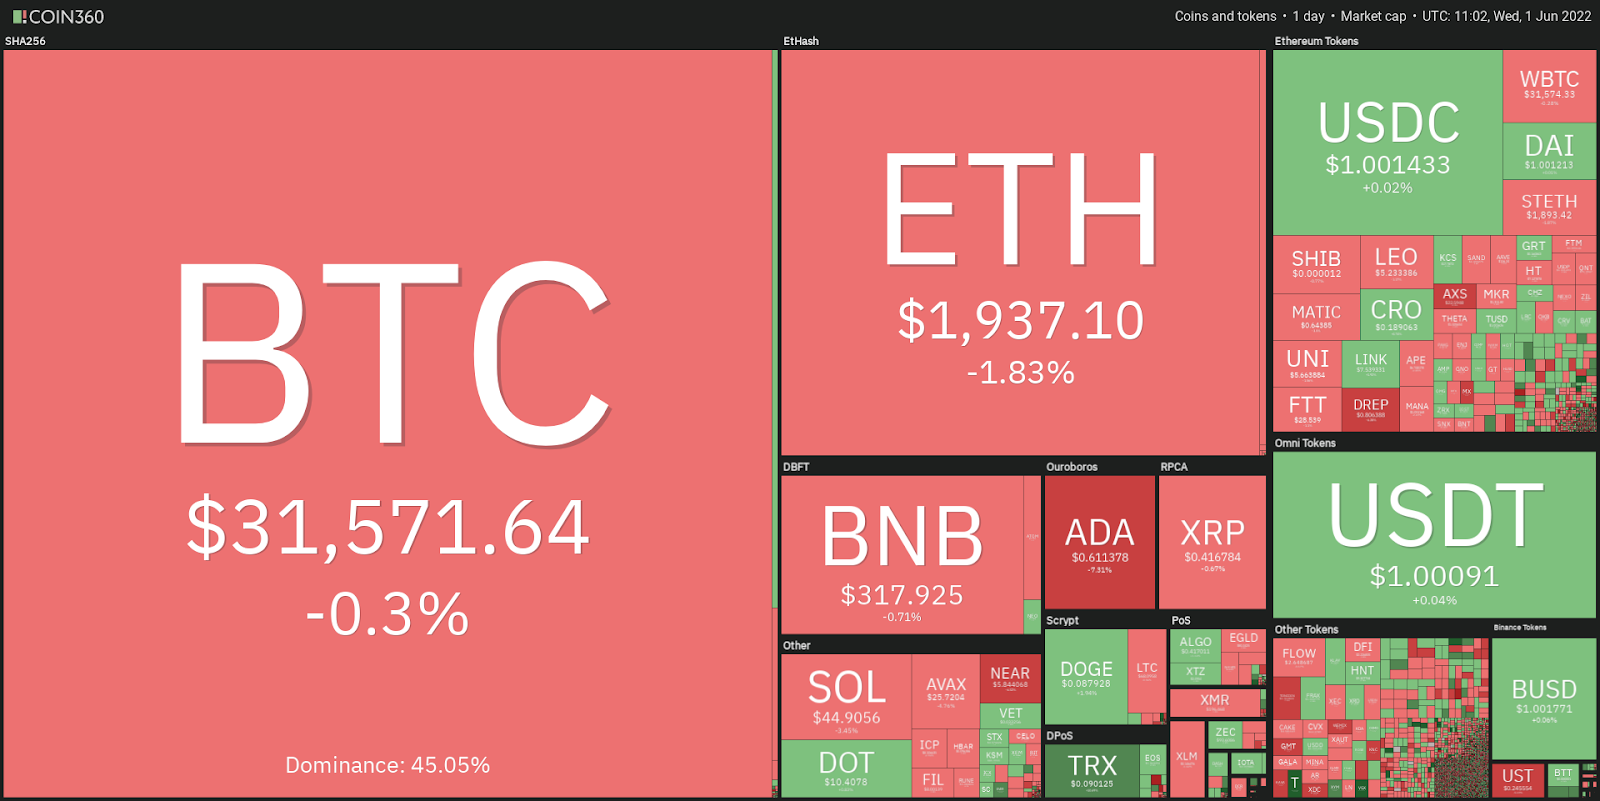
According to coin360 market dominance of Bitcoin(BTC) has also expanded upto 45%. The below heat map showcases BTC and other altcoins from the cryptocurrency market and their respective gains.
Let us now move on to the technical analysis of Bitcoin price.
Total Liquidations
According to coinglass, $275.56 Millions worth of BTC have been liquidated in the last 24-hour period. In which, $202.35 Millions worth of BTC have been liquidated in the last 12-hours only. It seems pretty uncommon to see that in the last 12-hours only most of the BTC has been liquidated then that of in the last 24-hour. The fear of losing hopes of BTC investors can be observed through the chart.
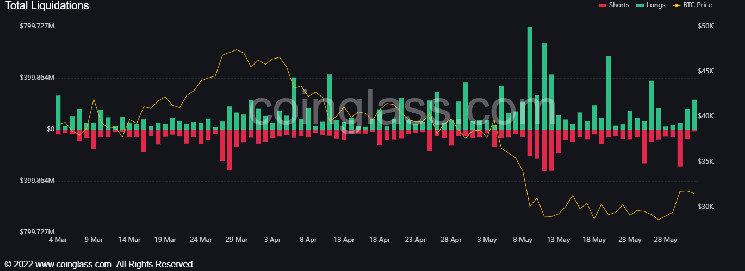
The above chart shows the liquidated amount on different cryptocurrency exchanges. If we talk about Binance, the most prominent and infamous cryptocurrency exchange, the total amount liquidated while being on short is $6.36 Million, and the total of $11.27 Millions worth of Bitcoin has been liquidated while being on long. Meanwhile, on Bitfinex has a total amount of $191.528M on long and 31.1K on short.
Crypto Fear to Greed Index
Fear to Greed Index shows the emotion of investors, whether the emotions of traders support the bullishness or they are still bearish regarding the cryptocurrency token. Greed drives the price of any security upwards or to surge as the traders start accumulating and fear, on the other hand, increases the selling pressure as traders start escalating out from the trade.
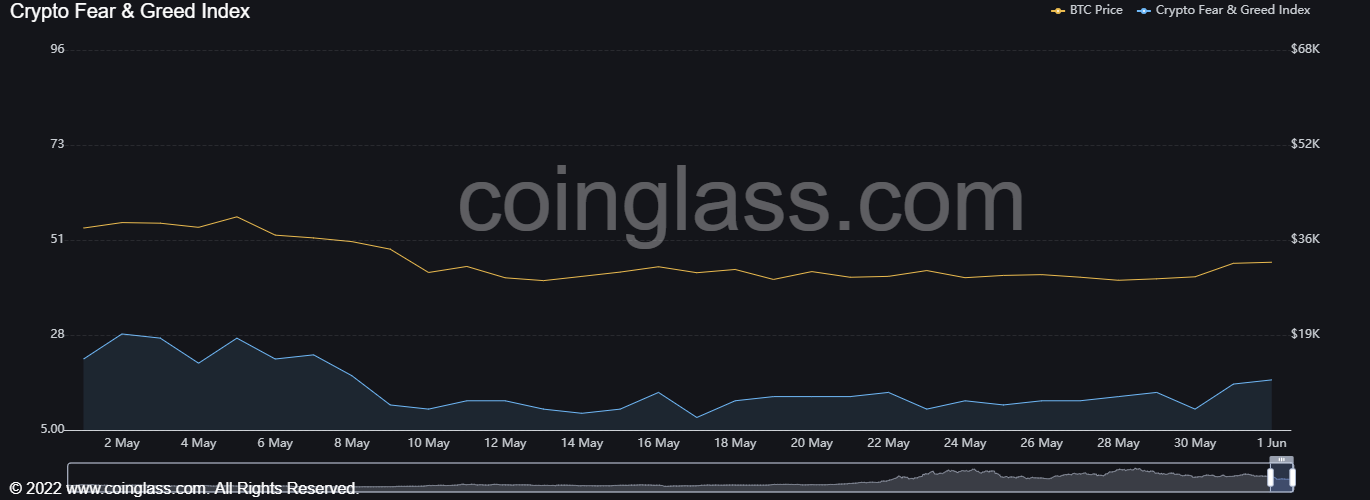
As of now, for Bitcoin, only coinglass shows that crypto fear to greed index is at 17, which means the condition of fear surrounds the cryptocurrency investors.
Bitcoin price is presently CMP at $31573 and has lost 0.54% of its market capitalization in the last 24-hour period. Trading volume has also decreased by 12.83% in the intraday trading session. This shows that BTC investors have some short sentiments for the token’s trade. The strong accumulation point is much needed for BTC to sustain above the range-bound area. Volume to market cap ratio is 0.05442.
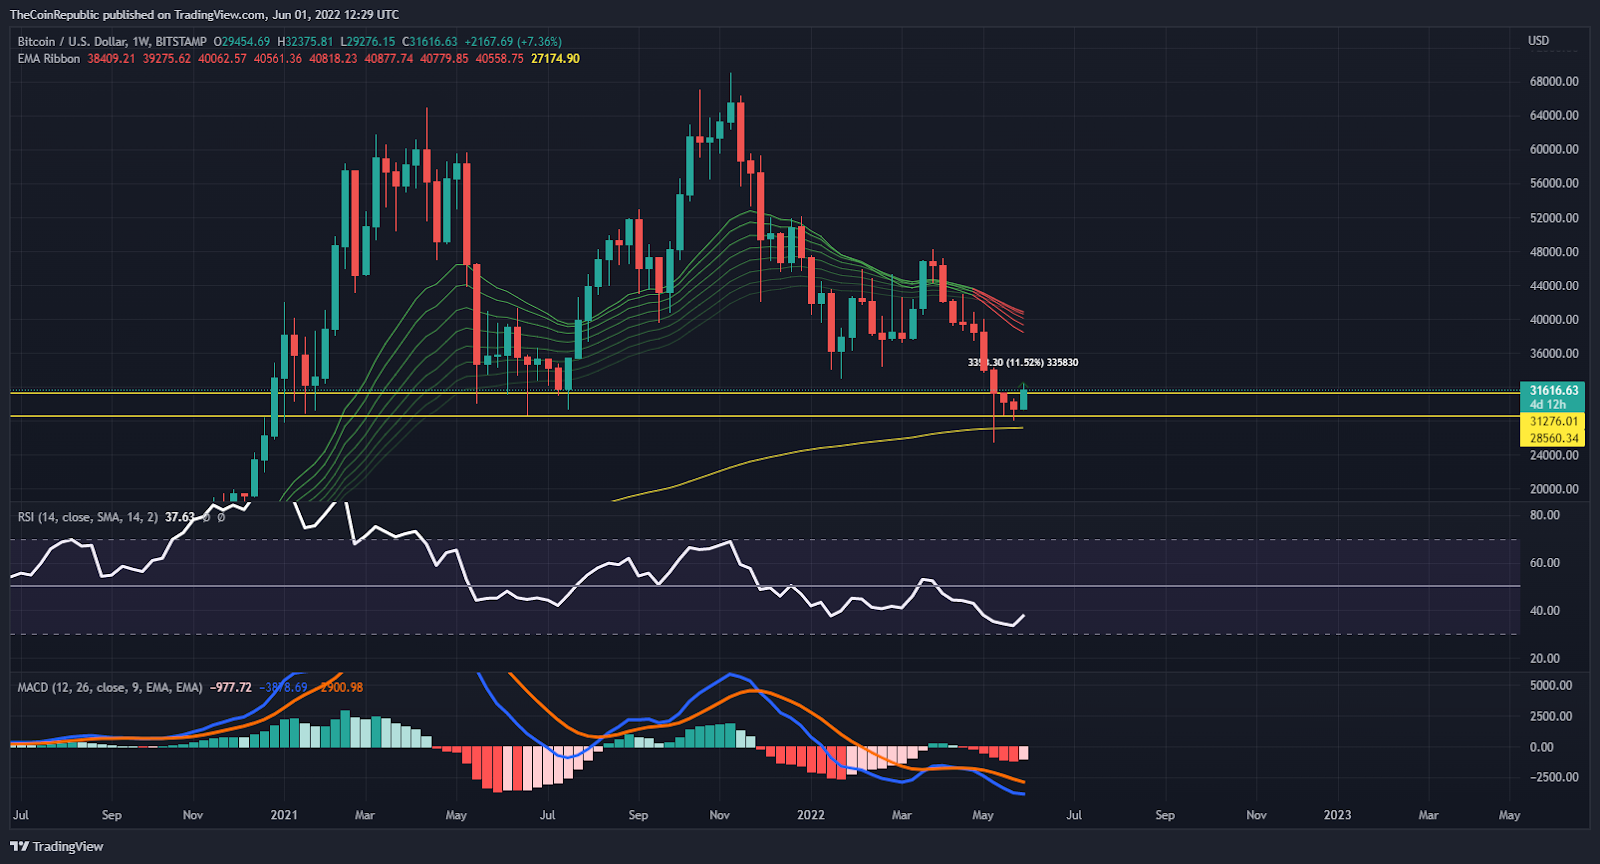
Bitcoin price is trading with a strong uptrend momentum over the weekly chart. This week has been very calming for the Bitcoin investors and also for the other cryptocurrency investors as Bitcoin holds the market dominance of 45% now. All other altcoins also started rallying bullish over the charts. BTC is trying to sustain above the $31000 level as it has been consolidating inside the range for the last few weeks. BTC has been closing blood-red candles for the last nine consecutive weeks, but now it seems the recovery phase has finally started.
Technical indicators suggest the uptrend momentum of BTC over the weekly chart. The EMA ribbon shows the bearish momentum of Bitcoin as the price change lies below the EMA lines. Trend reversal can be expected as soon as the price change crosses the EMA line upwards.
Relative Strength Index showcases the bullish momentum of Bitcoin. As the token is trying to gain towards neutrality. MACD exhibits the uptrend momentum as the MACD line approaches the signal line for a positive crossover.
Conclusion
Bitcoin price is trading with a strong uptrend momentum over the weekly chart. This week has been very calming for the Bitcoin investors and also for the other cryptocurrency investors as Bitcoin holds the market dominance of 45% now. However, now Bitcoin has started this week’s candle by gaining around 11% and is still gaining over the weekly chart. As of now, for Bitcoin, only coinglass shows that crypto fear to greed index is at 17, which means the condition of fear surrounds the cryptocurrency investors.
Technical Levels
Support Levels: $28500
Resistance Levels: $32000
Disclaimer
The views and opinions stated by the author, or any people named in this article, are for informational ideas only, and they do not establish the financial, investment, or other advice. Investing in or trading crypto assets comes with a risk of financial loss.