Key highlights:
- Bitcoin is now up by 6% this week as the coin trades near $31,500.
- BTC/USD surged higher on Monday to break the previous fortnight of consolidation.
- The next resistance lies at $32,400.
| Bitcoin price | $31,200 |
| Key support levels | $31,000, $30,800, $30,500, $30,320, $30,000, $29,890, $29,500 |
| Key resistance levels | $32,000, $32,270, $32,560, $33,520, $34,000, $34,490 |
*Price at the time of publication
Bitcoin started to show some promise in the final days of May. After an extremely rough month, in which prices dipped beneath $26,000, it seems the bears took a break in the final few days to allow Bitcoin to surge as high as $32,400.
The surge started in the early hours of Monday morning and continued throughout the start of the week as BTC/USD surged above $31,000 to break the consolidation seen in the market over the past fortnight. It appears the bullish pressure has stalled slightly at around $32,000 as the sellers pushed BTC beneath the $31,400 support.
Despite the recently birthed bullish recovery, data still suggests that large entities are continuing to sell the momentum. The Top 10 Inflows metric to all exchanges helps us to measure the selling pressure from large entities;
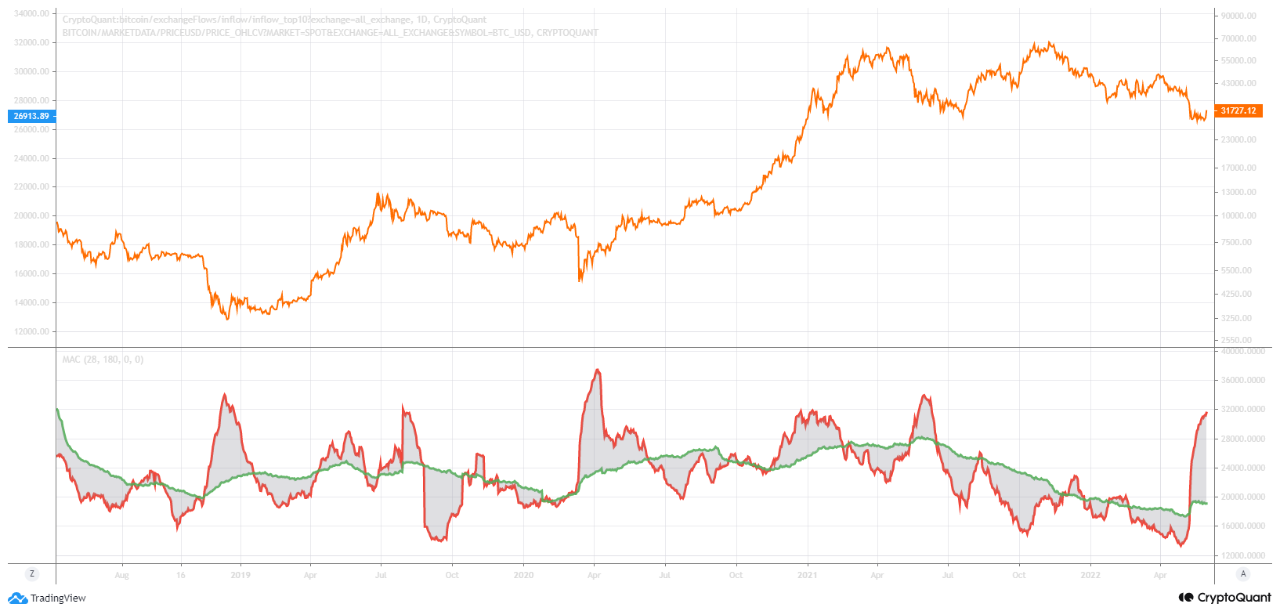
Image source: CryptoQuant, TradingView
The chart above shows the metric’s 28-day and 180-day moving averages. As you can see, the selling momentum is still extraordinarily high and might help to explain where prices above $30,000 are constantly being rejected.
On the other hand, the Accumulation Trend Score is starting to head back to 1, indicating that a large proportion of on-chain users are adding to their wallets;
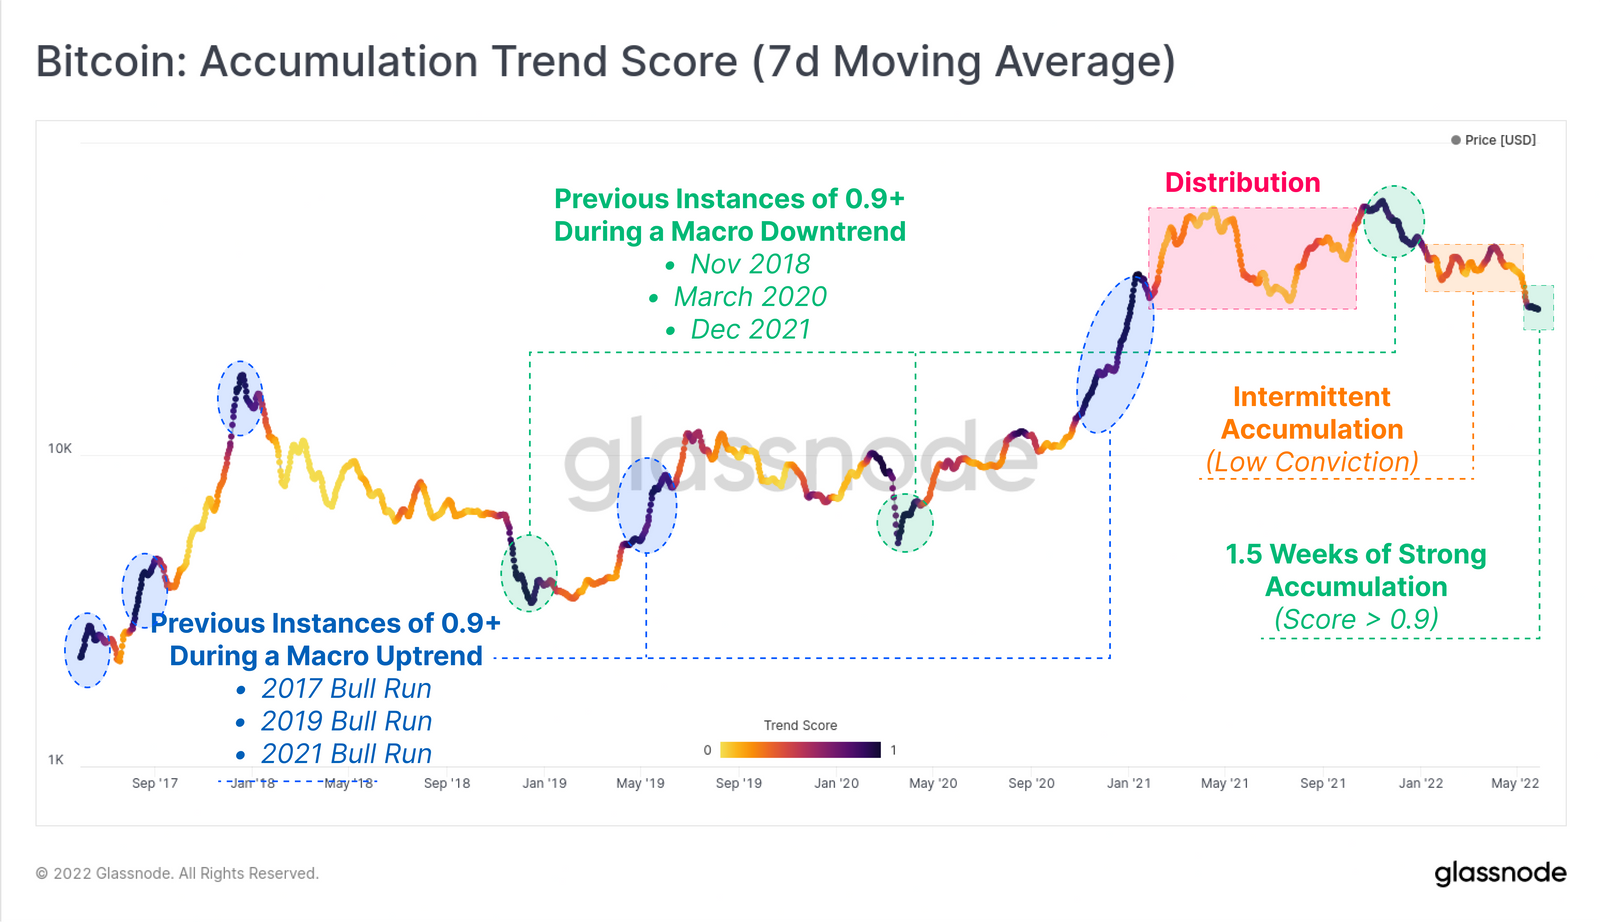
Image source: Glassnode
The current high score is during a bearish trend. It is generally triggered after significant corrections in price action. It could be the first indication that investors’ psychology is starting to move away from totally uncertain market conditions.
Taking a deeper look into which cohort of investors are actually accumulating, we can see that investors have bought the majority of the recent upswing with less than 100 BTC in their wallet and investors with more than 10,000 BTC;
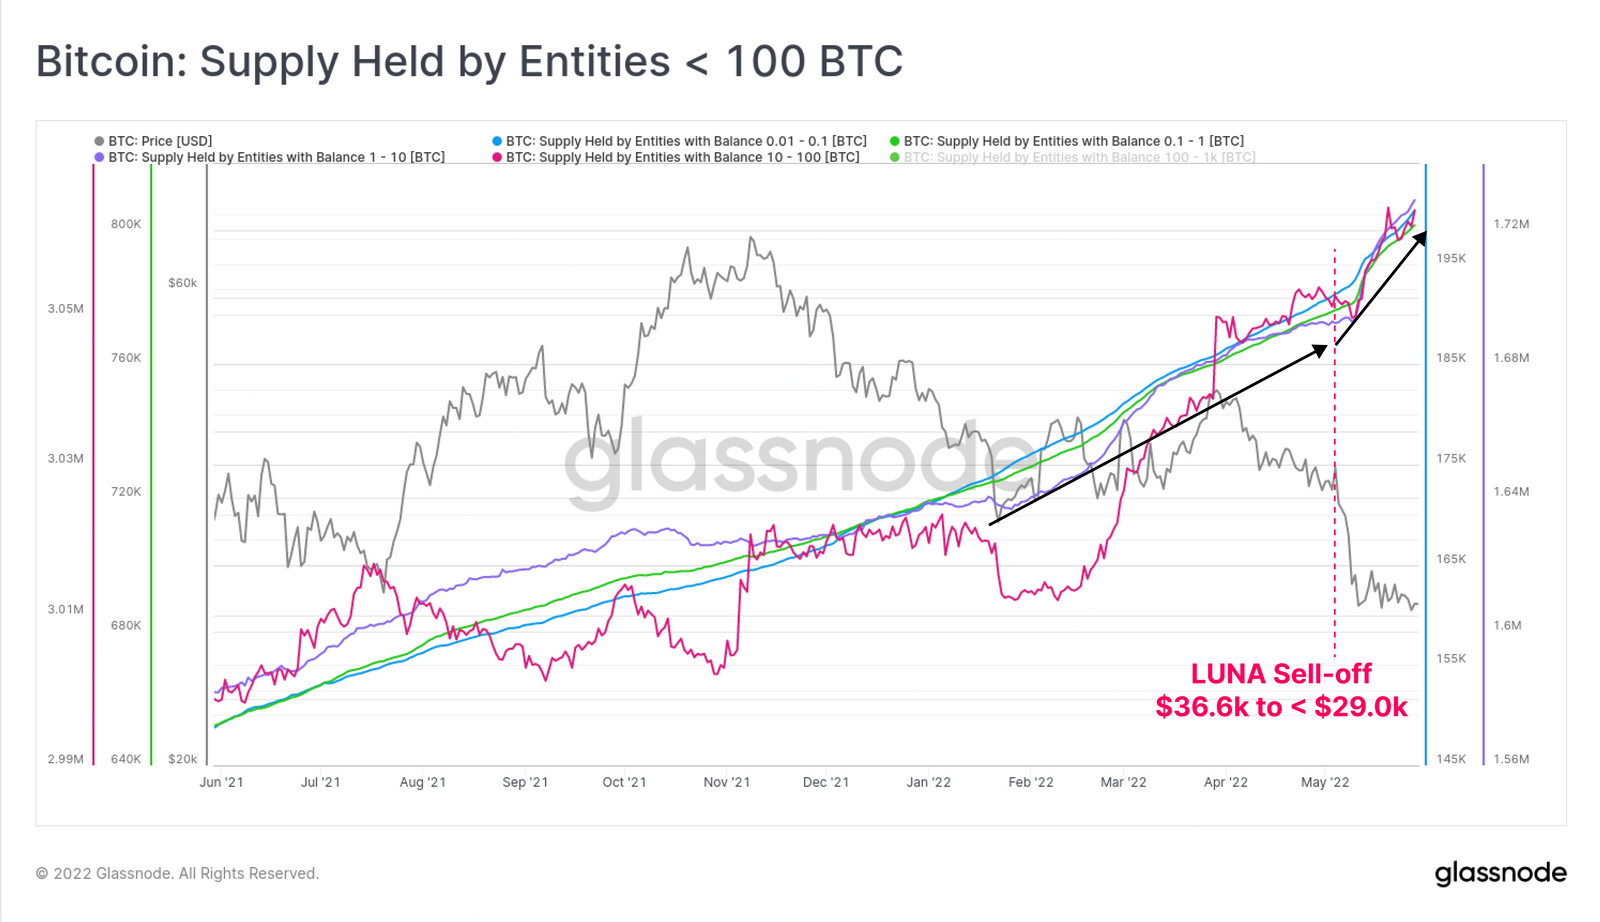
Image source: Glassnode
Interestingly, investors with less than 100 BTC in their wallets increased their holdings by over 80,500 BTC on aggregate - a similar figure to the 80,000 BTC sold by the Luna Foundation Guard.
Overall, the market is still uncertain, and we will need to look primarily at price action to dictate any short-term directions. So let us take a closer look at the charts and see the potential areas of support and resistance moving forward.
Bitcoin Price Analysis
BTC/USD daily price chart
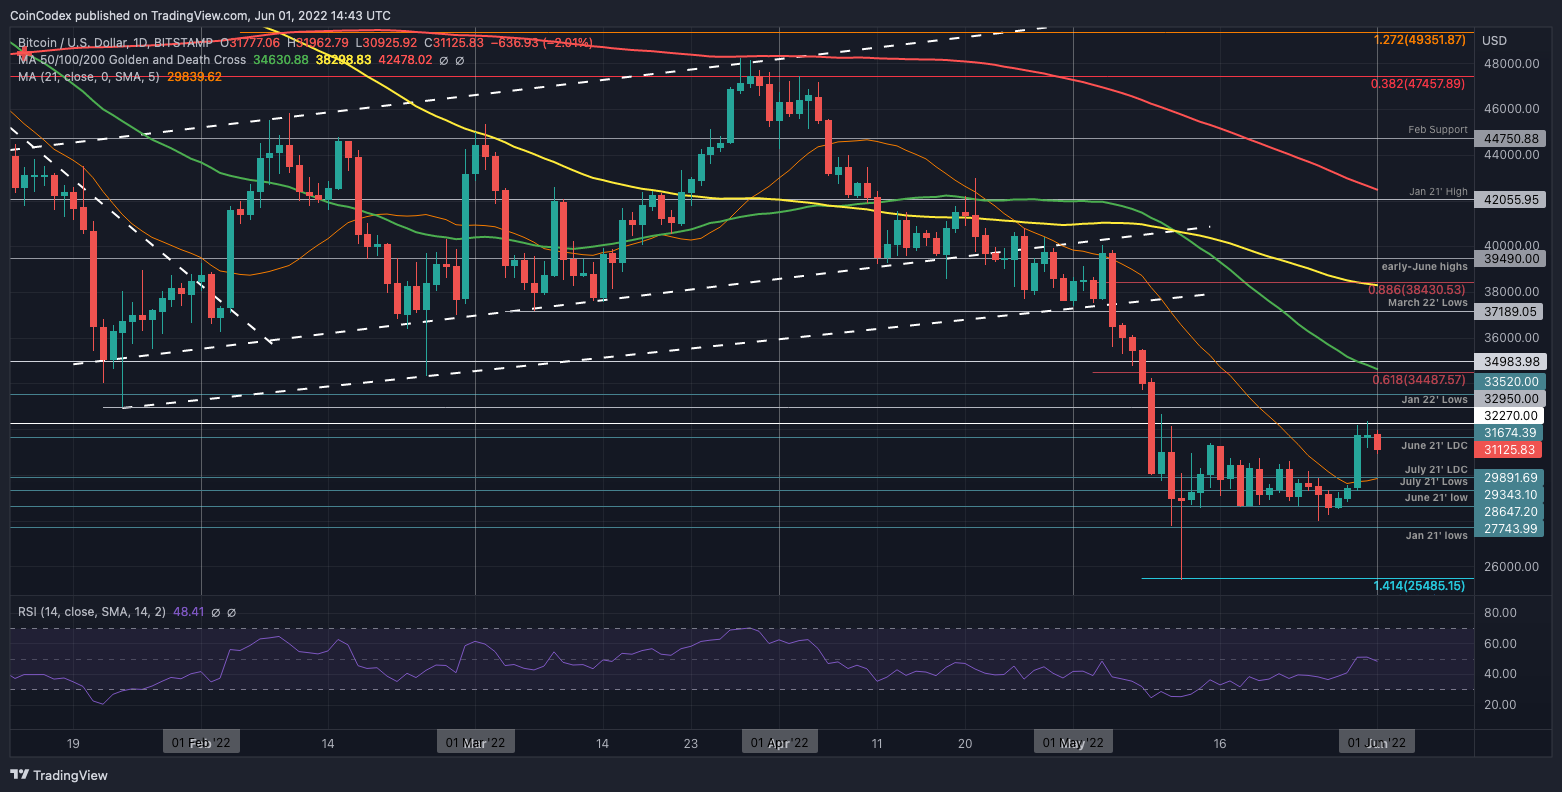
Image source: TradingView
BTC/USD 4-hour price chart
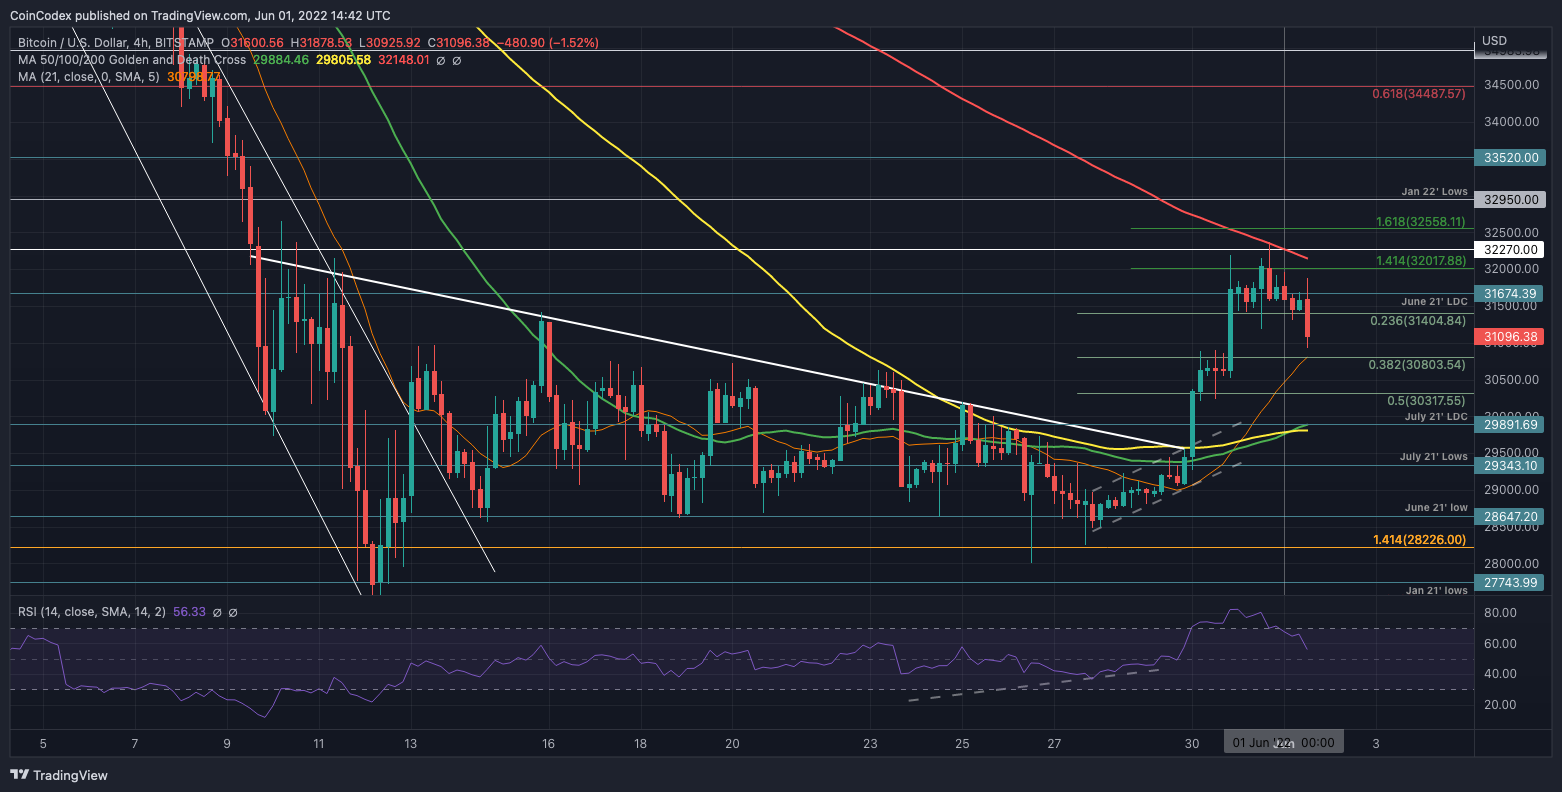
Image source: TradingView
What has been going on?
The 4-hour chart provides the best perspective on the short-term market movements. We can see that BTC was trapped in a period of consolidation for a fortnight following the mid-May market capitulation. The range was between $30,500 and support at $28,650 (June 2021 lows), and BTC struggled to break out of these two boundaries for two weeks.
The breakout came at the start of the week when BTC finally broke above $30,500. After that, it continued to surge higher over the first half of the week until hitting a high of around $32,400 yesterday. More specifically, BTC struggled to overcome resistance at a 1.414 Fib Extension at $32,000.
Bitcoin has since rolled over to drop beneath support at $31,400 (.236 Fib Retracement) and meet lower support at $31,000.
Bitcoin price short-term prediction: Bearish
Bitcoin continues to remain bearish in the short term. BTC would need to break and close beneath the January 2021 lows for the bearish pressure to continue further.
To be considered neutral again, the coin would need to break back above $32,950 - January 2022 lows.
To be considered bullish, it would have to continue above the May highs at $40,000.
The first level of support now lies at $30,800 (.382 Fib Retracement). This is followed by support at $30,500, $30,320 (.5 Fib Retracement), $30,000, and $29,890 (July 21’ Low-day closing price).
Additional support can be expected at $29,350 (July 21’ lows), $29,000, and $28,650 (June 21’ lows).
Where is the resistance toward the upside?
On the other side, the first level of resistance is located at $31,500. This is followed by $31,650, $32,000 (1.414 Fib Extension), $32,270, and $32,560 (1.618 Fib Extension).
If the buyers can continue to push higher, added resistance is then to be expected at $32,950 (Jan 22’ Lows), $33,520, $34,000, and $34,490 (bearish .618 Fib Retracement).
So, where are we heading next?
The recent price surge has given hope to many bulls within the market. The break of the fortnight's worth of consolidation is quite significant to push higher ahead.
However, BTC has already rolled over on the daily chart at the time of publishing, and it looks like a retracement might be on the card already. Additionally, although the RSI has climbed from extremely bearish conditions, it is failing to establish any bullish momentum in the daily time frame. For BTC to continue beyond $33,000, we need to see the RSI climb higher from the mid-line to indicate increasing bullish momentum.
The Fibonacci Retracement levels on the 4-hour timeframe will be the best levels of support in this current retracement over the next couple of days. A retracement toward $30,500 (previous range) might be a good level to look for buying opportunities.
Keep up to date with the latest Bitcoin Price Predictions here.
 coincodex.com