After bouncing at a crucial horizontal level, Bitcoin (BTC) is making an attempt at breaking out above a short-term descending resistance line.
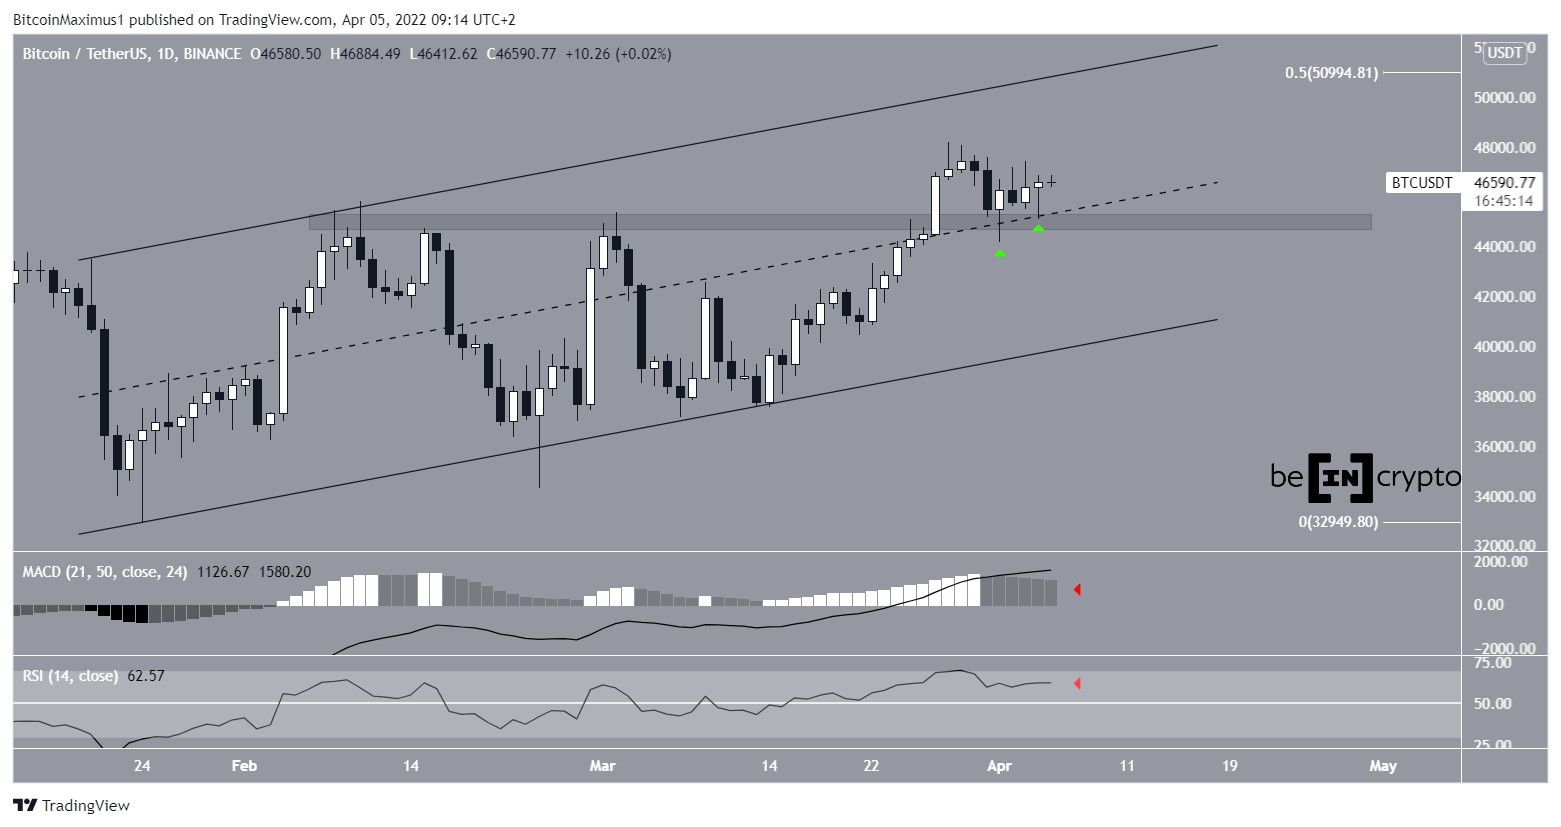
Bitcoin has been increasing inside an ascending parallel channel since Jan. 24. On March 27, it broke out above the midline of the channel and the $44,800 horizontal area.
It then returned and validated the area as support on April 1 (green icon), and again on April 4. It created long lower wicks each time. These are considered signs of buying pressure since sellers tried to push the price down but failed to do so. The daily close was higher than the opening, creating a bullish candlestick in the process.
If BTC continues to increase, the next resistance would be found at $51,000. This is the resistance line of the channel and the 0.5 Fib retracement resistance level.
While both the MACD and RSI have shown some weakness due to the fact that they are decreasing, they are still well into positive territory.
Another attempt at breaking out
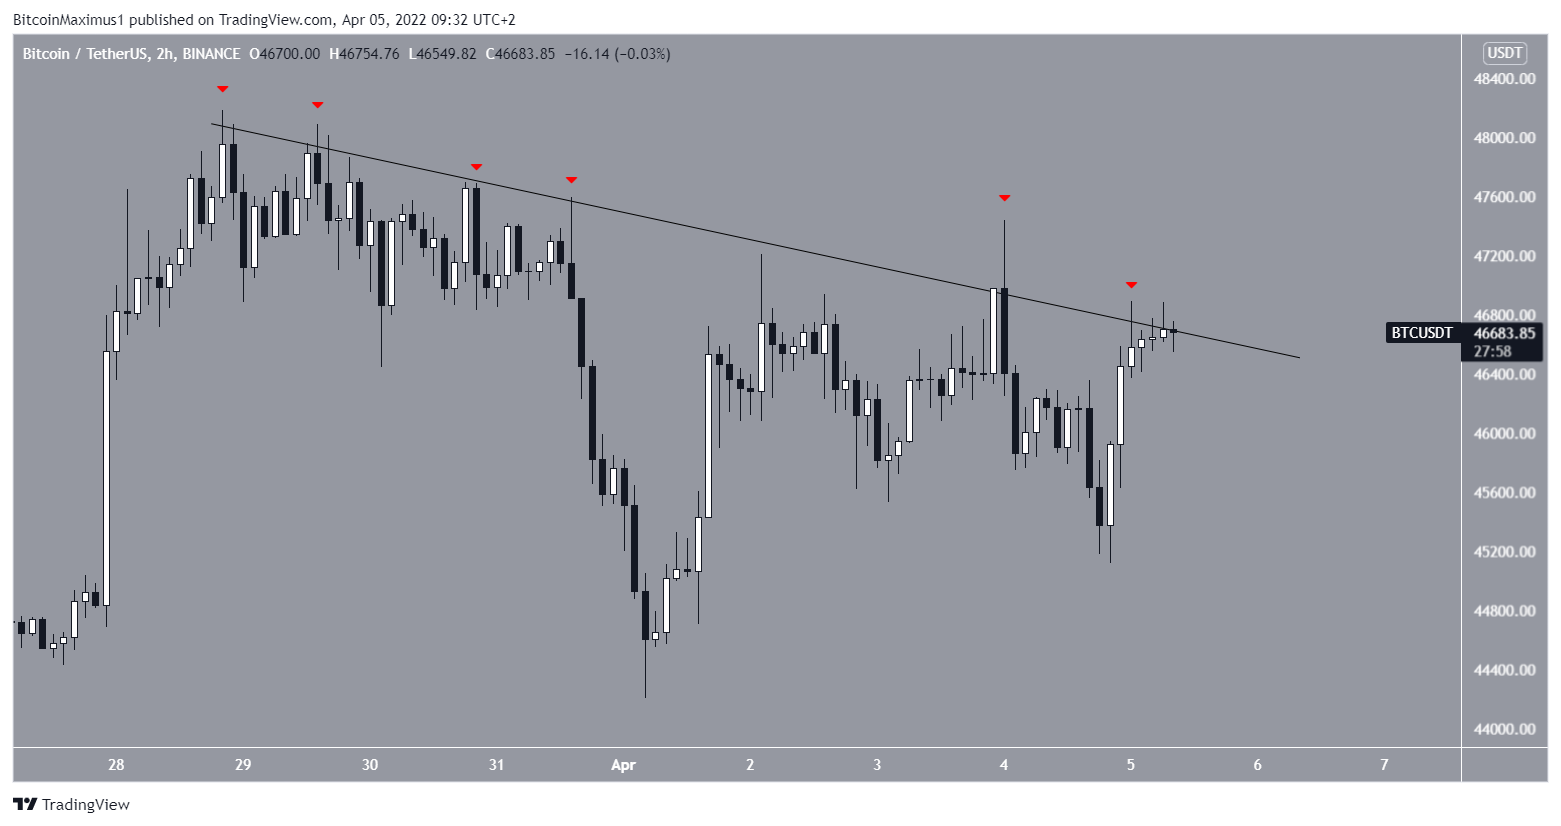
The two-hour chart shows that BTC has been following a descending resistance line since March 28. So far, it has made six attempts at breaking out (red icons) and is currently making its seventh attempt.
Resistances get weaker each time they are touched. When combining this with the bullish readings from the daily time frame, a breakout seems to be the most likely scenario.
BTC wave count analysis
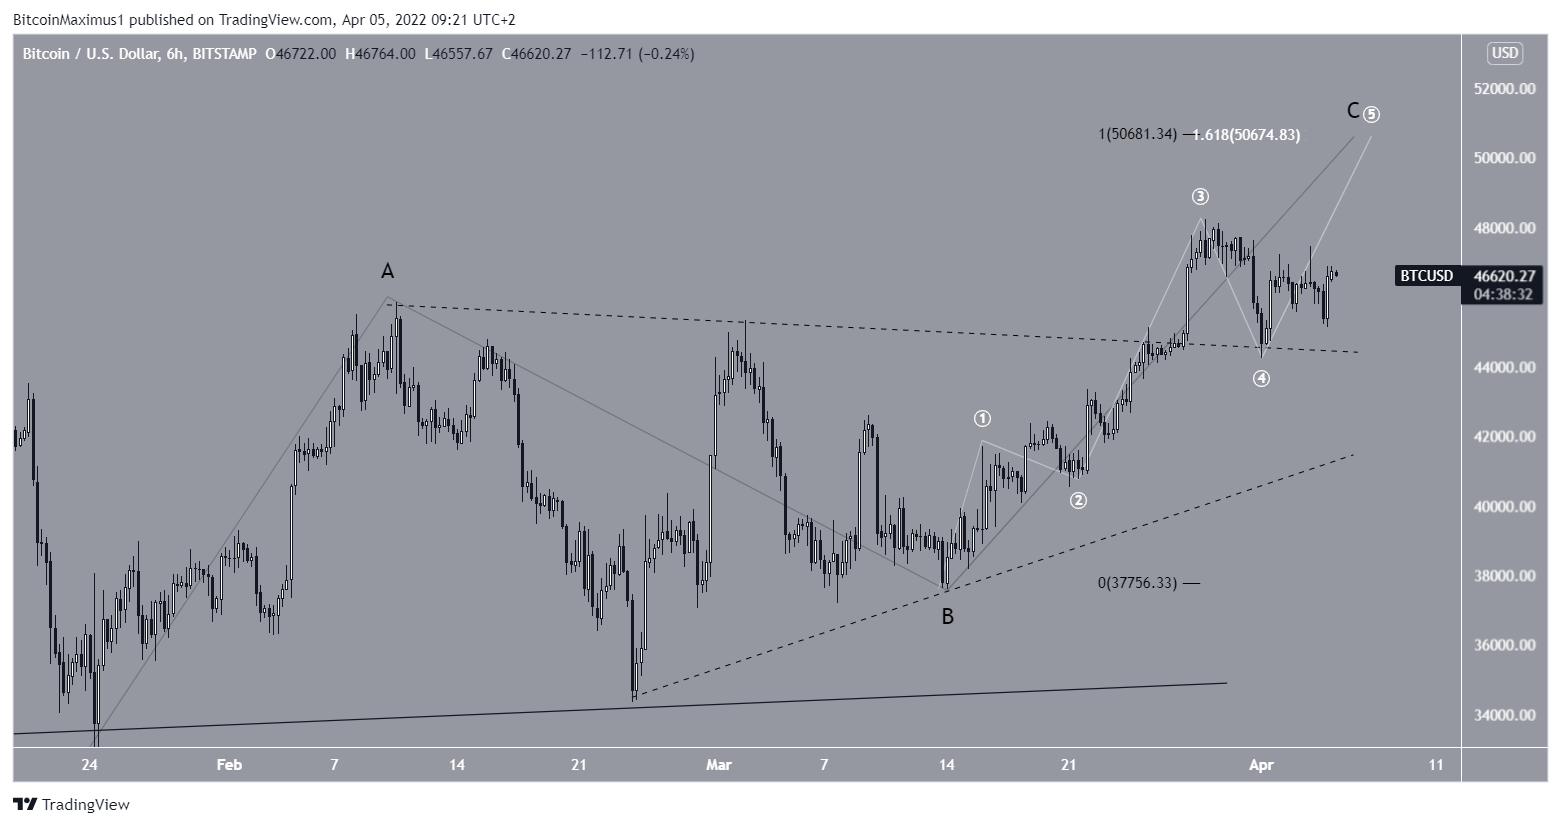
The wave count suggests that BTC is in the final portion of wave C in an A-B-C structure (black). The sub-wave count is shown in white, suggesting that the price is in the fifth and final wave.
A likely target for the top of the movement is found at $50,700. This target is the 1.61 external retracement on wave four (white) and would give waves A and C a 1:1 ratio (black). Also, it’s very close to the resistance area outlined in the previous section.
Due to the confluence of these factors, it would make sense for BTC to reach a local high near these levels.
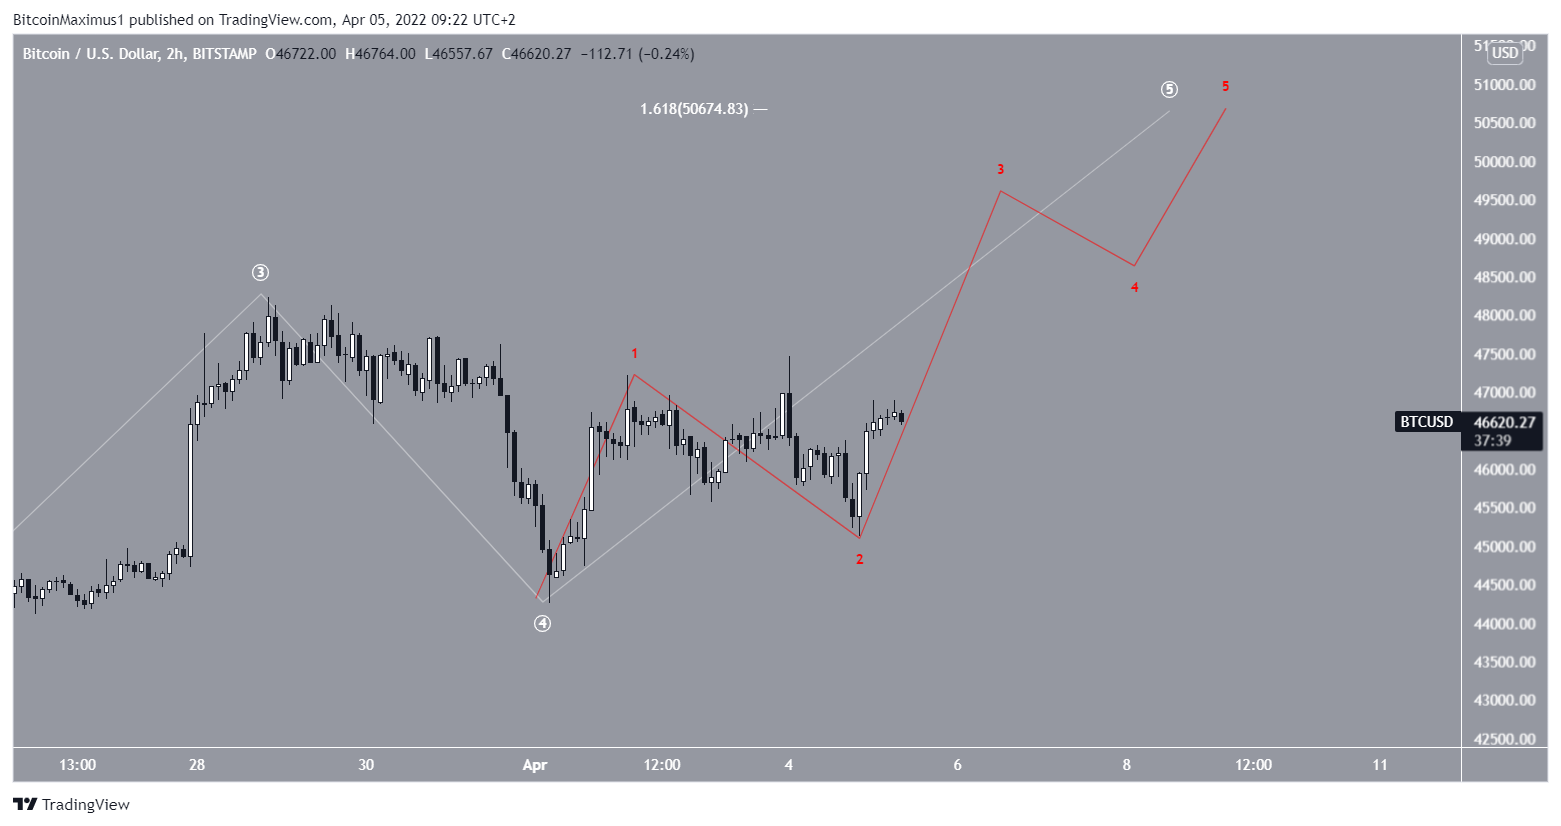
The two-hour chart gives an outlook on the minor sub-wave count (red). It suggests that BTC is currently in minor sub-wave three. A decrease below yesterday’s low of $45,214 would invalidate this particular wave count.
For BeInCrypto’s previous Bitcoin (BTC) analysis, click here