Bulls are losing power at the end of the week, according to the price change over the last 24 hours.
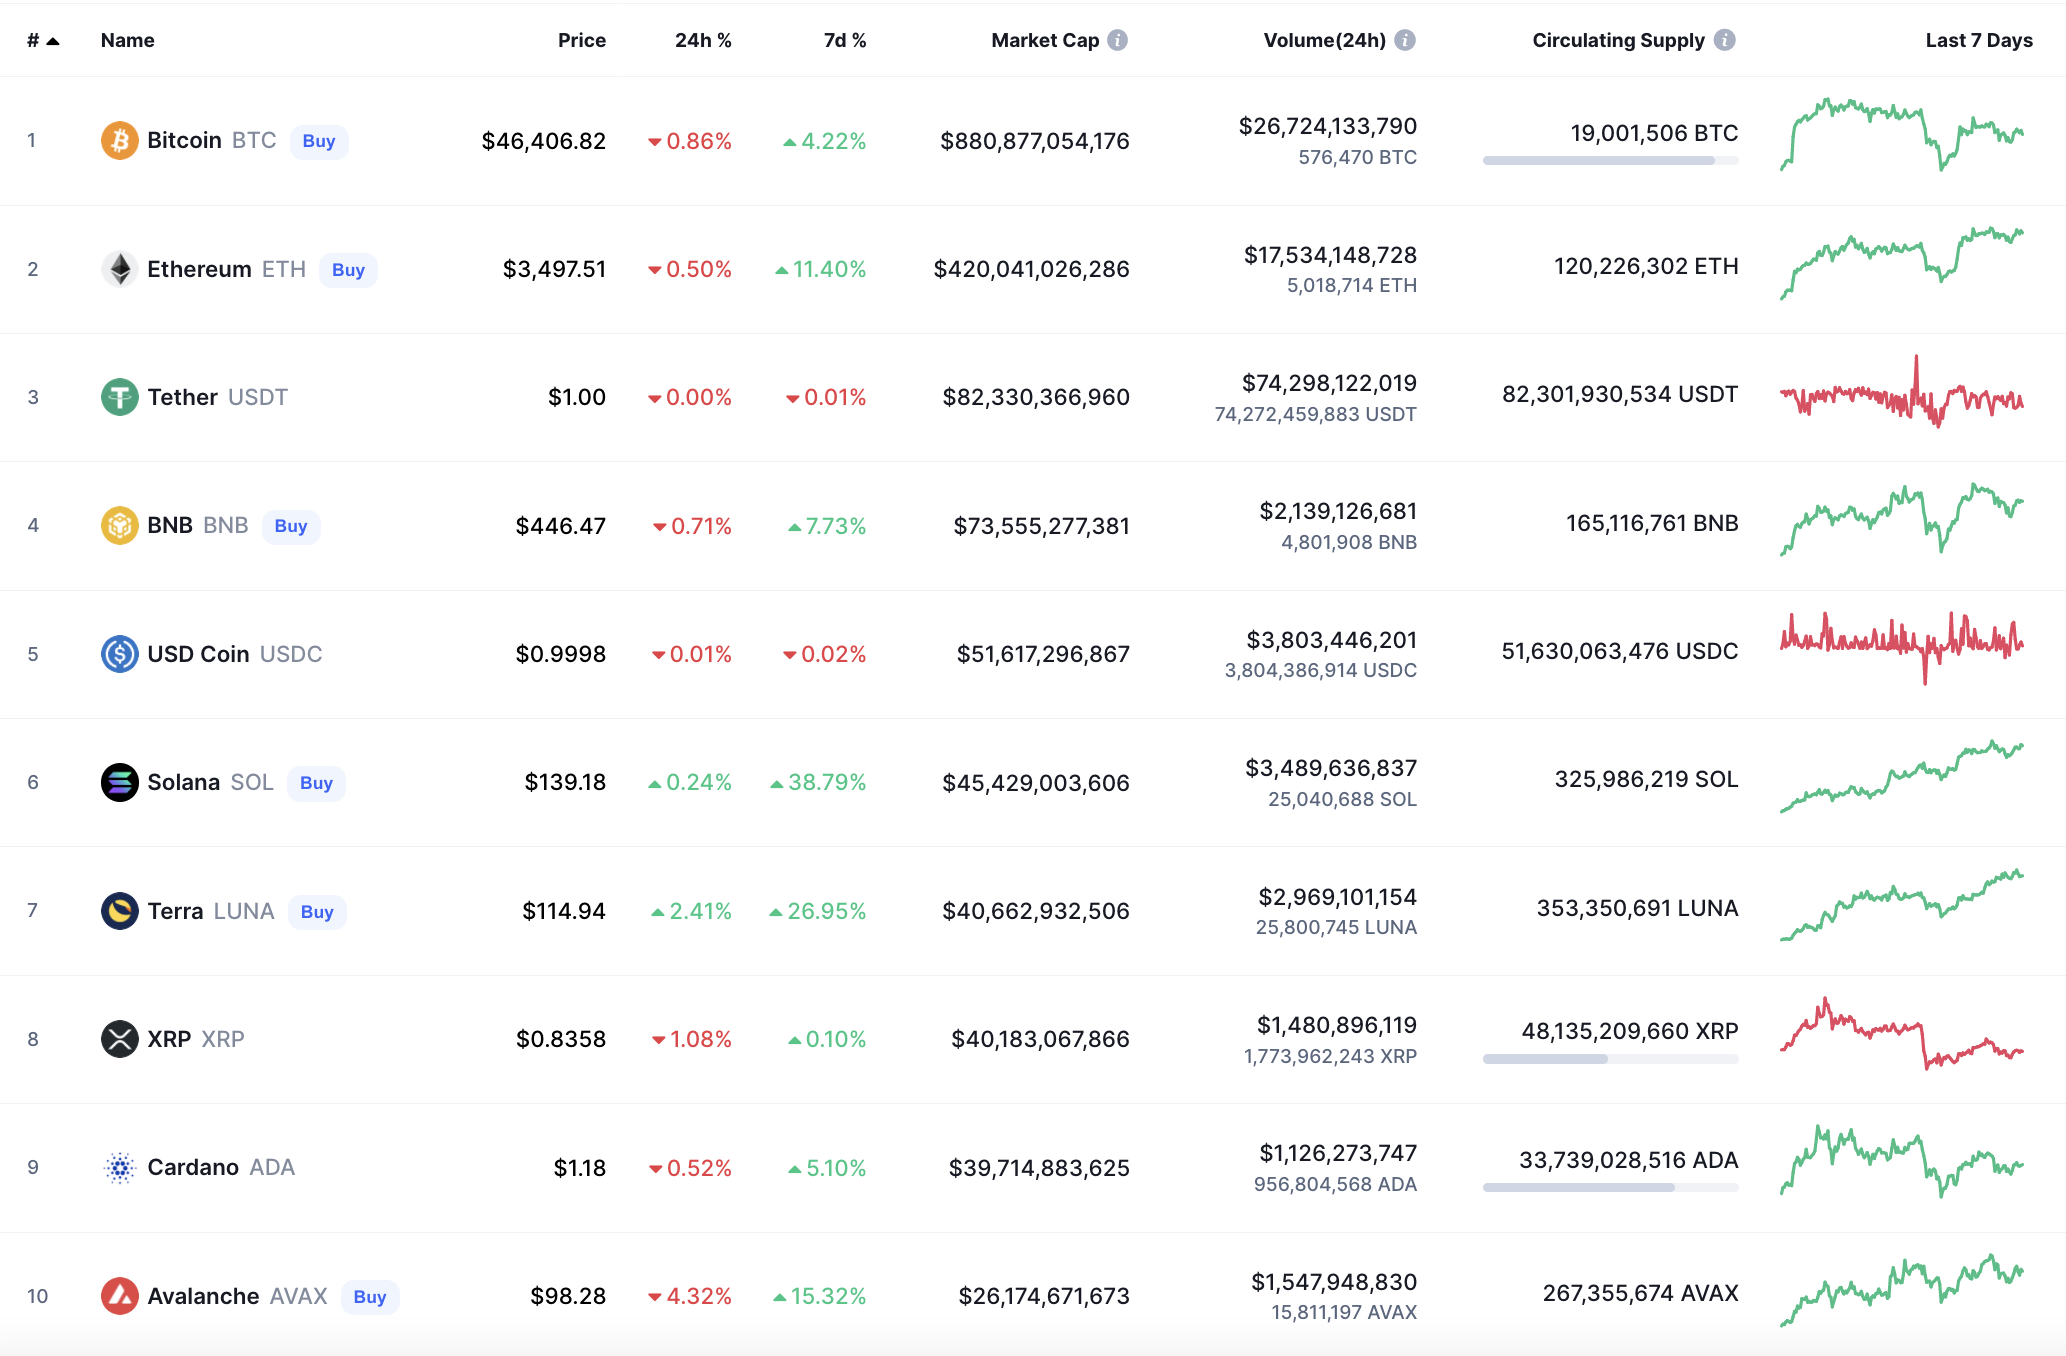
BTC/USD
Even though the rate of Bitcoin (BTC) has declined by 0.85% since yesterday, the rise over the last week has made up 4.37%.
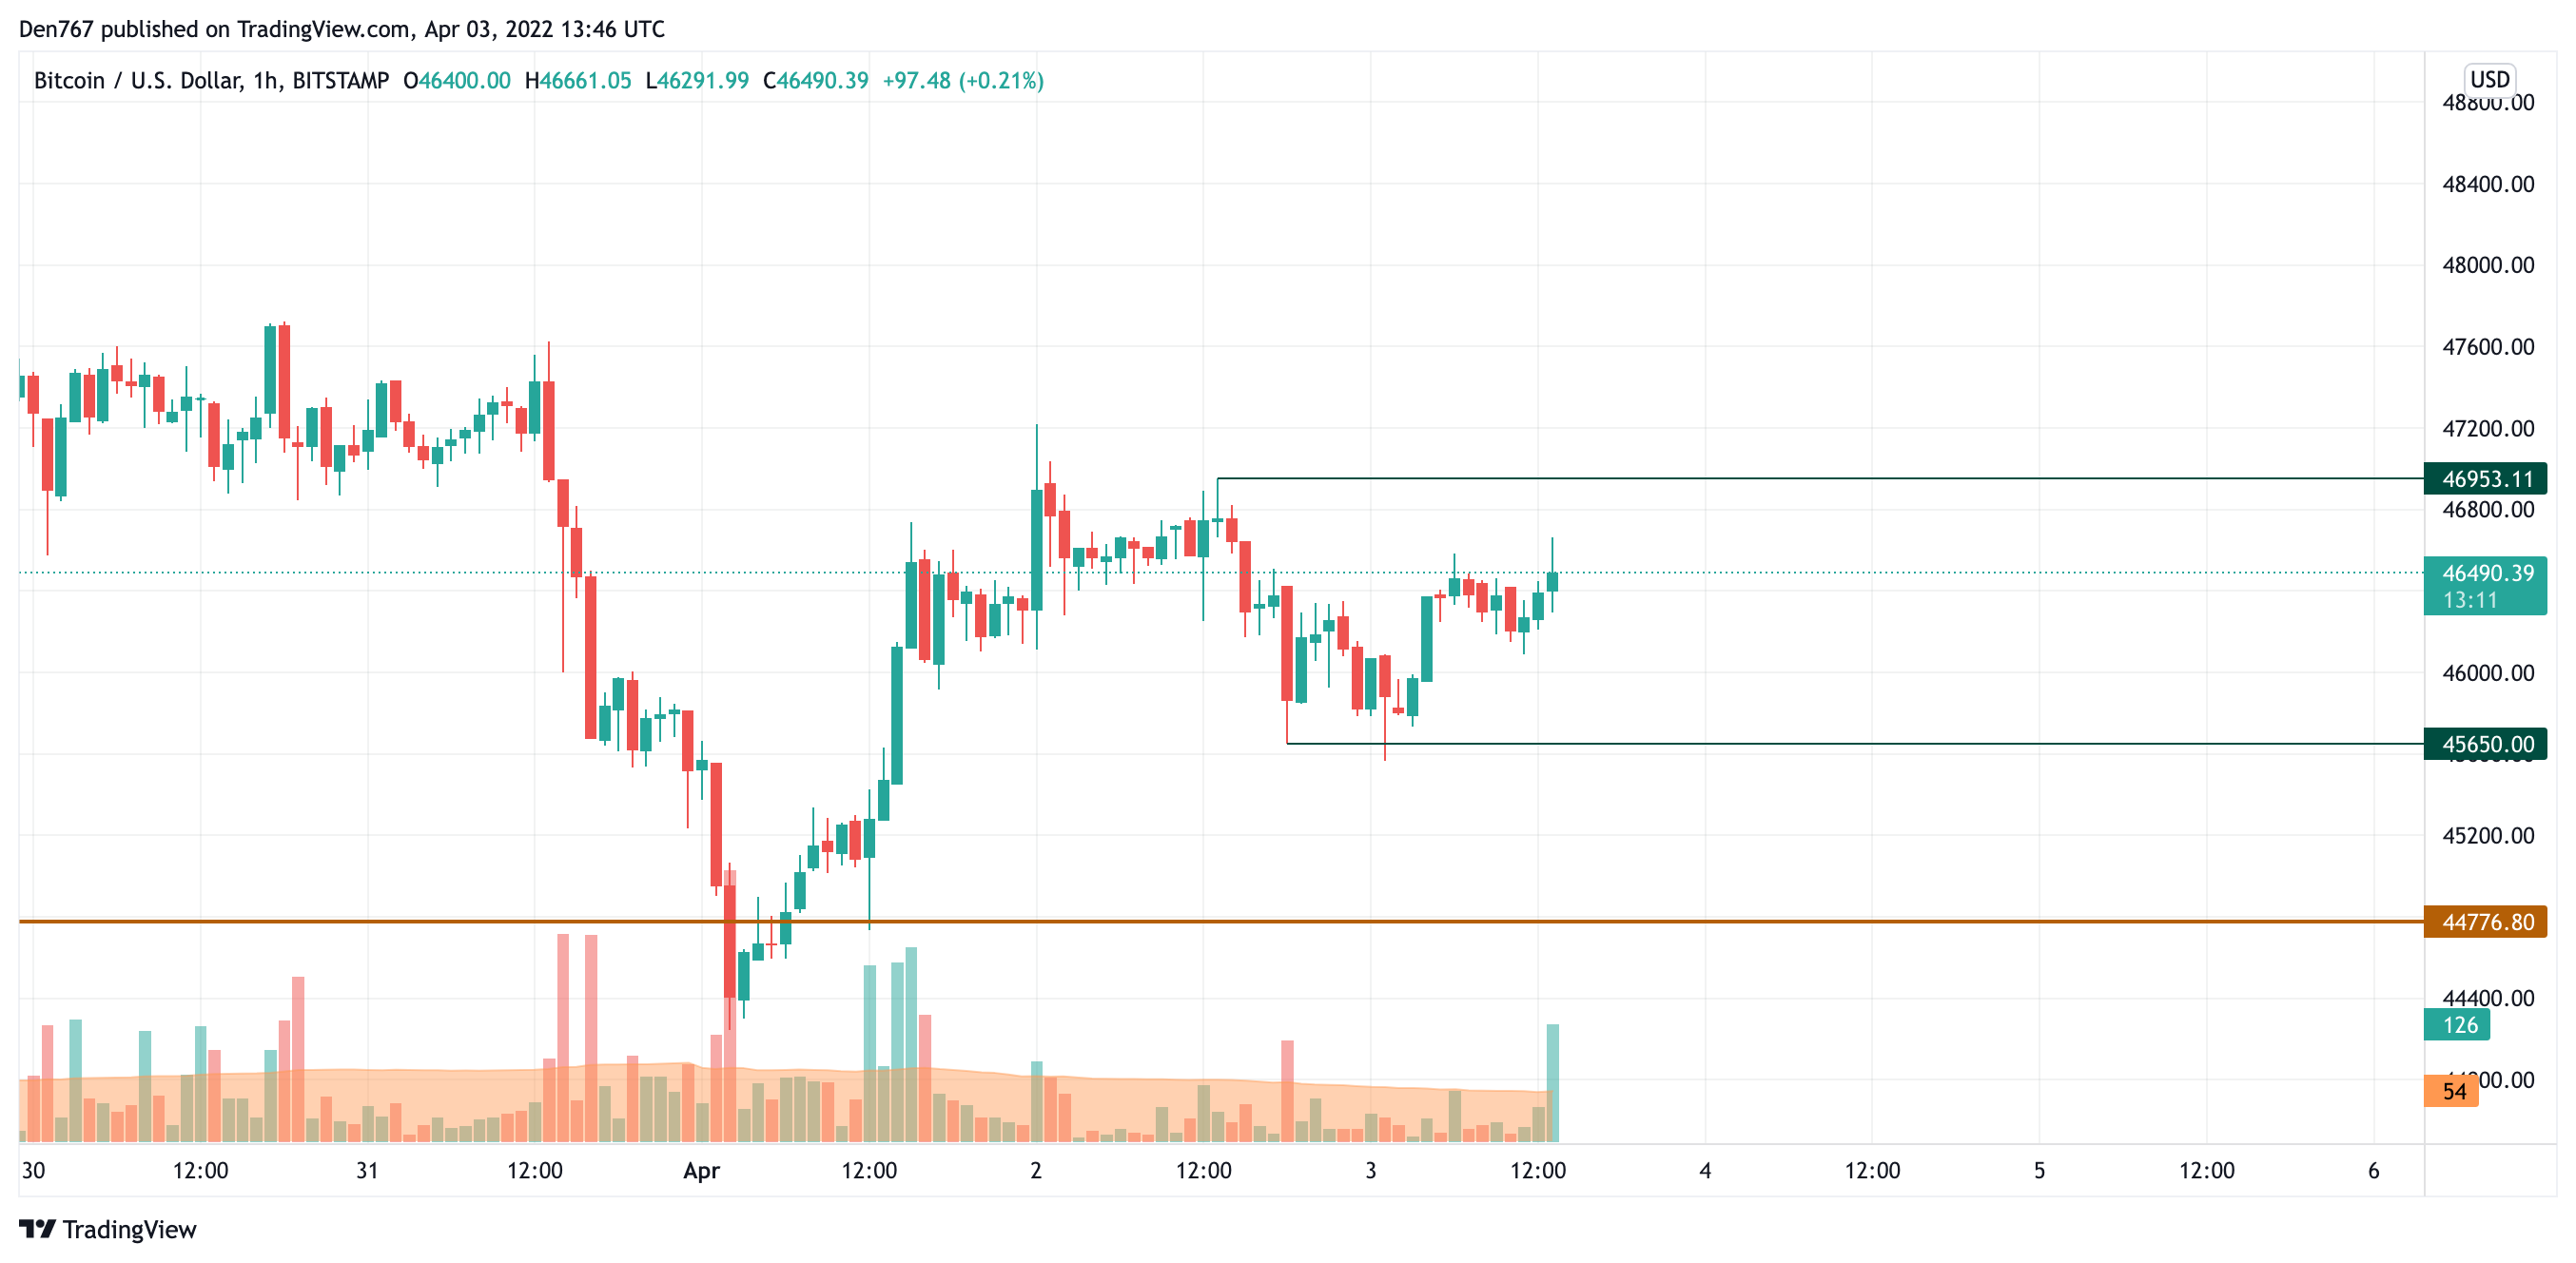
On the hourly chart, Bitcoin (BTC) is trading in the middle of the local channel between the support at $45,650 and the resistance at $46,953. The buying volume has blasted, which confirms buyers' energy. If the rise continues, BTC may reach $47,000 by the end of the day.
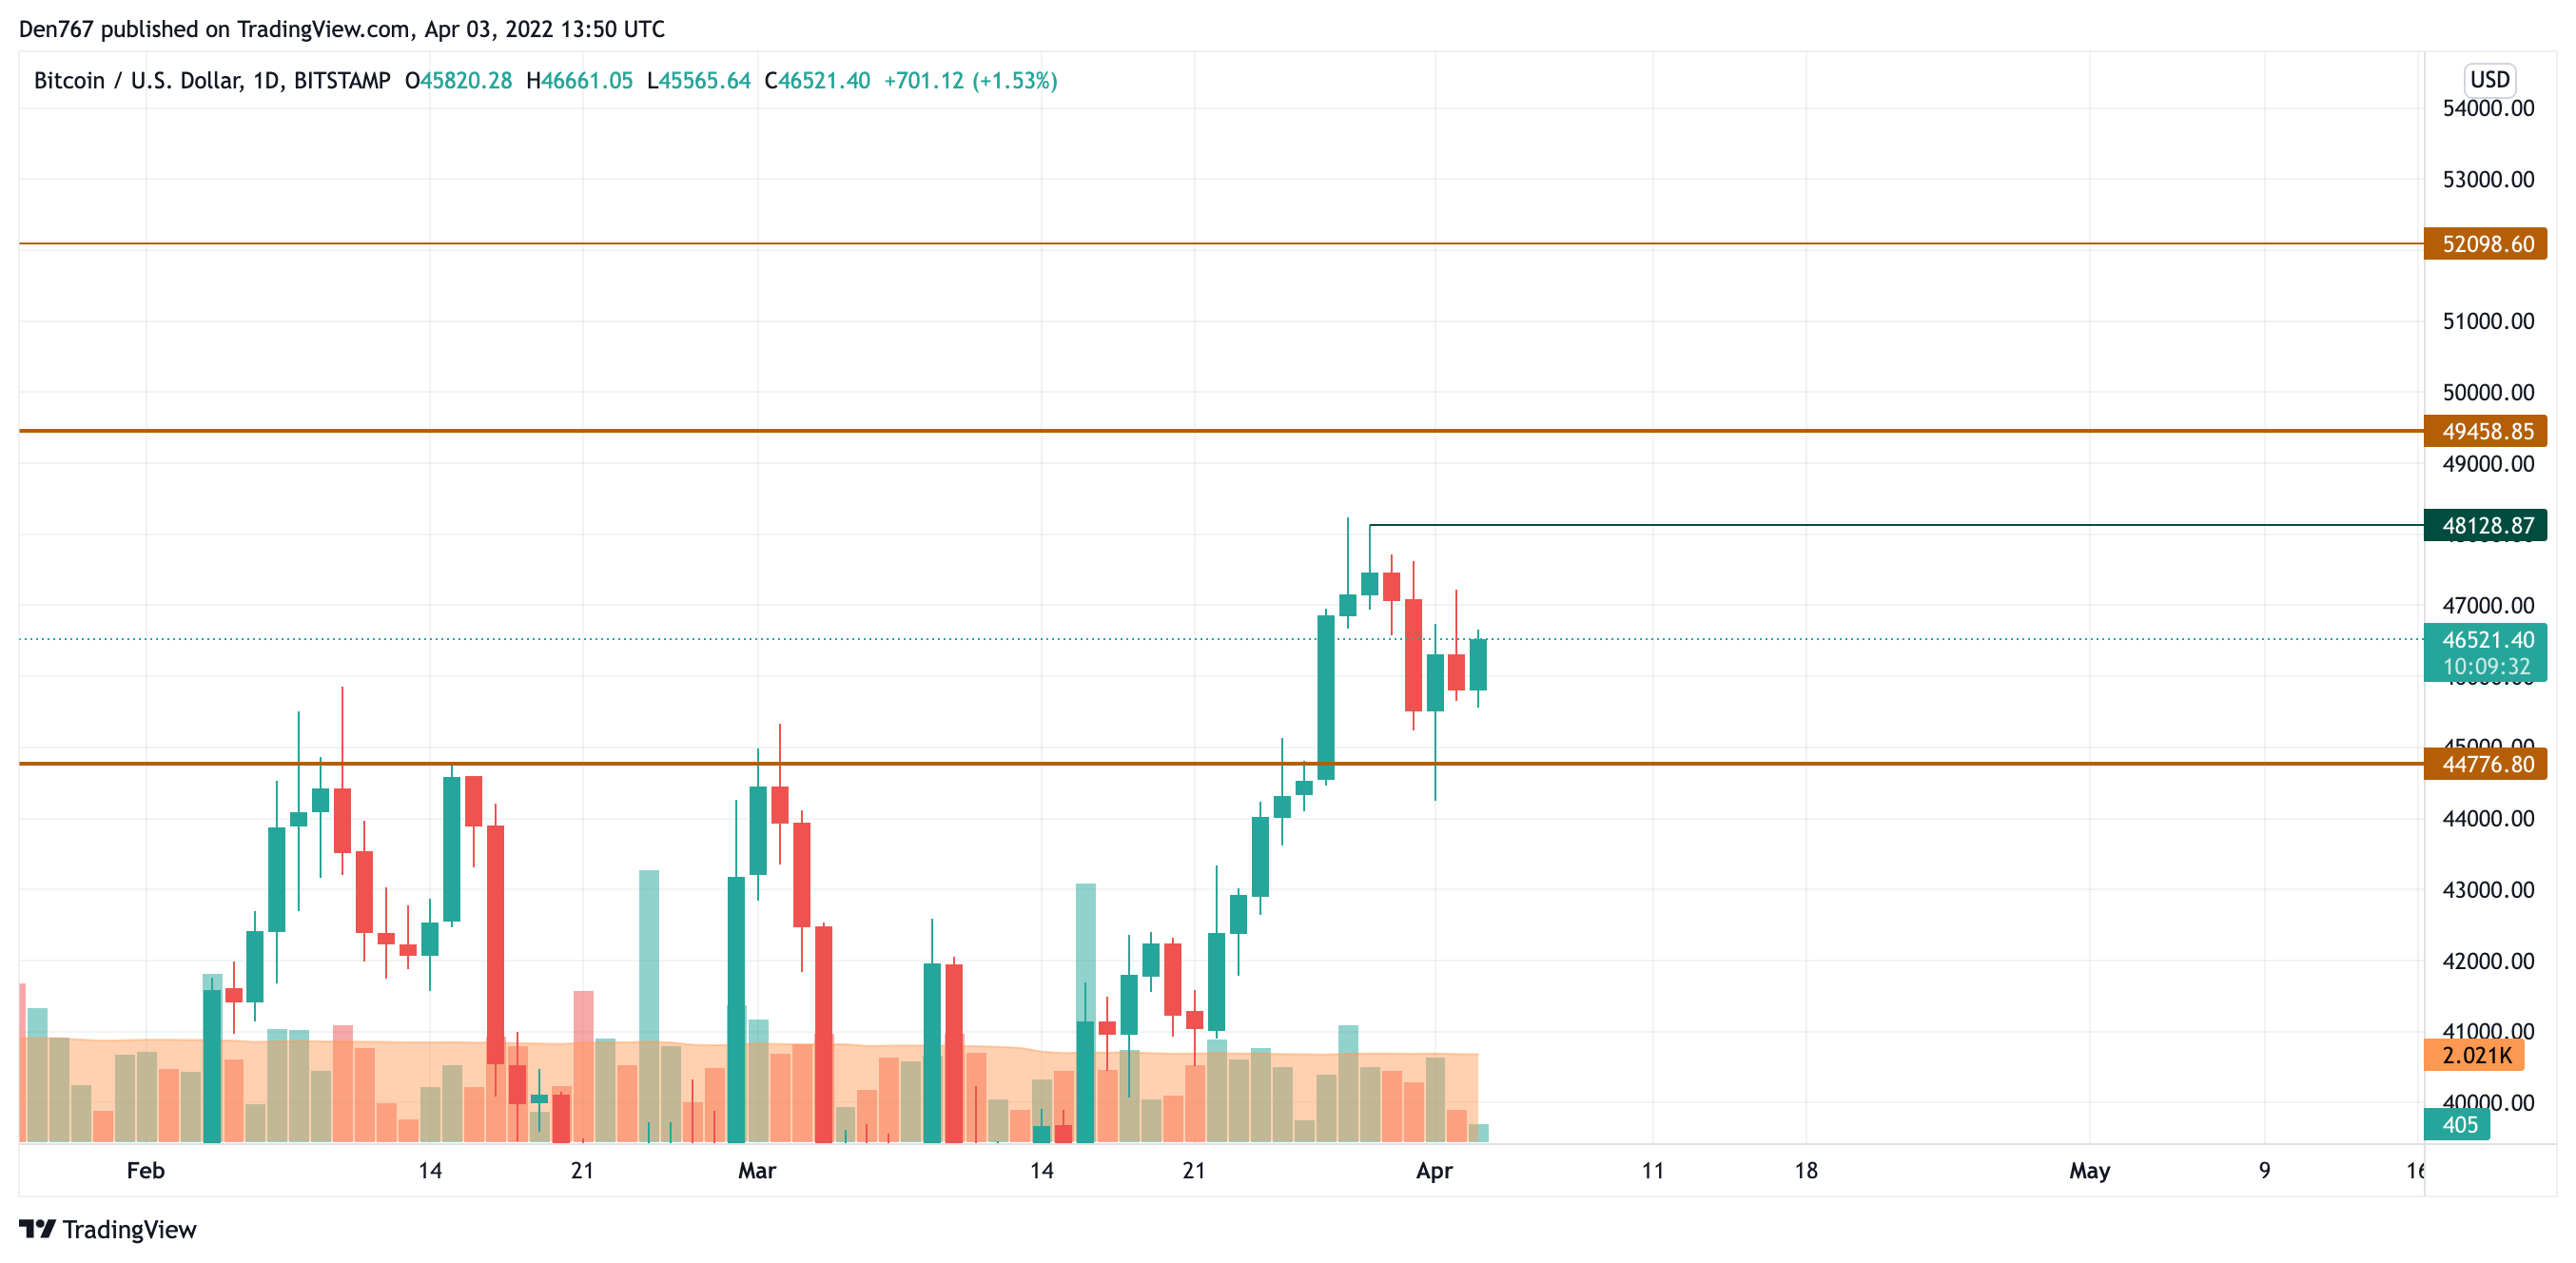
On the daily time frame, Bitcoin (BTC) has bounced off the support level at $44,776, which means that bulls remain more powerful than bears.
If the price can hold in the range of $46,000-$47,000 by the end of the week, the growth may lead to the zone of $48,000 shortly.
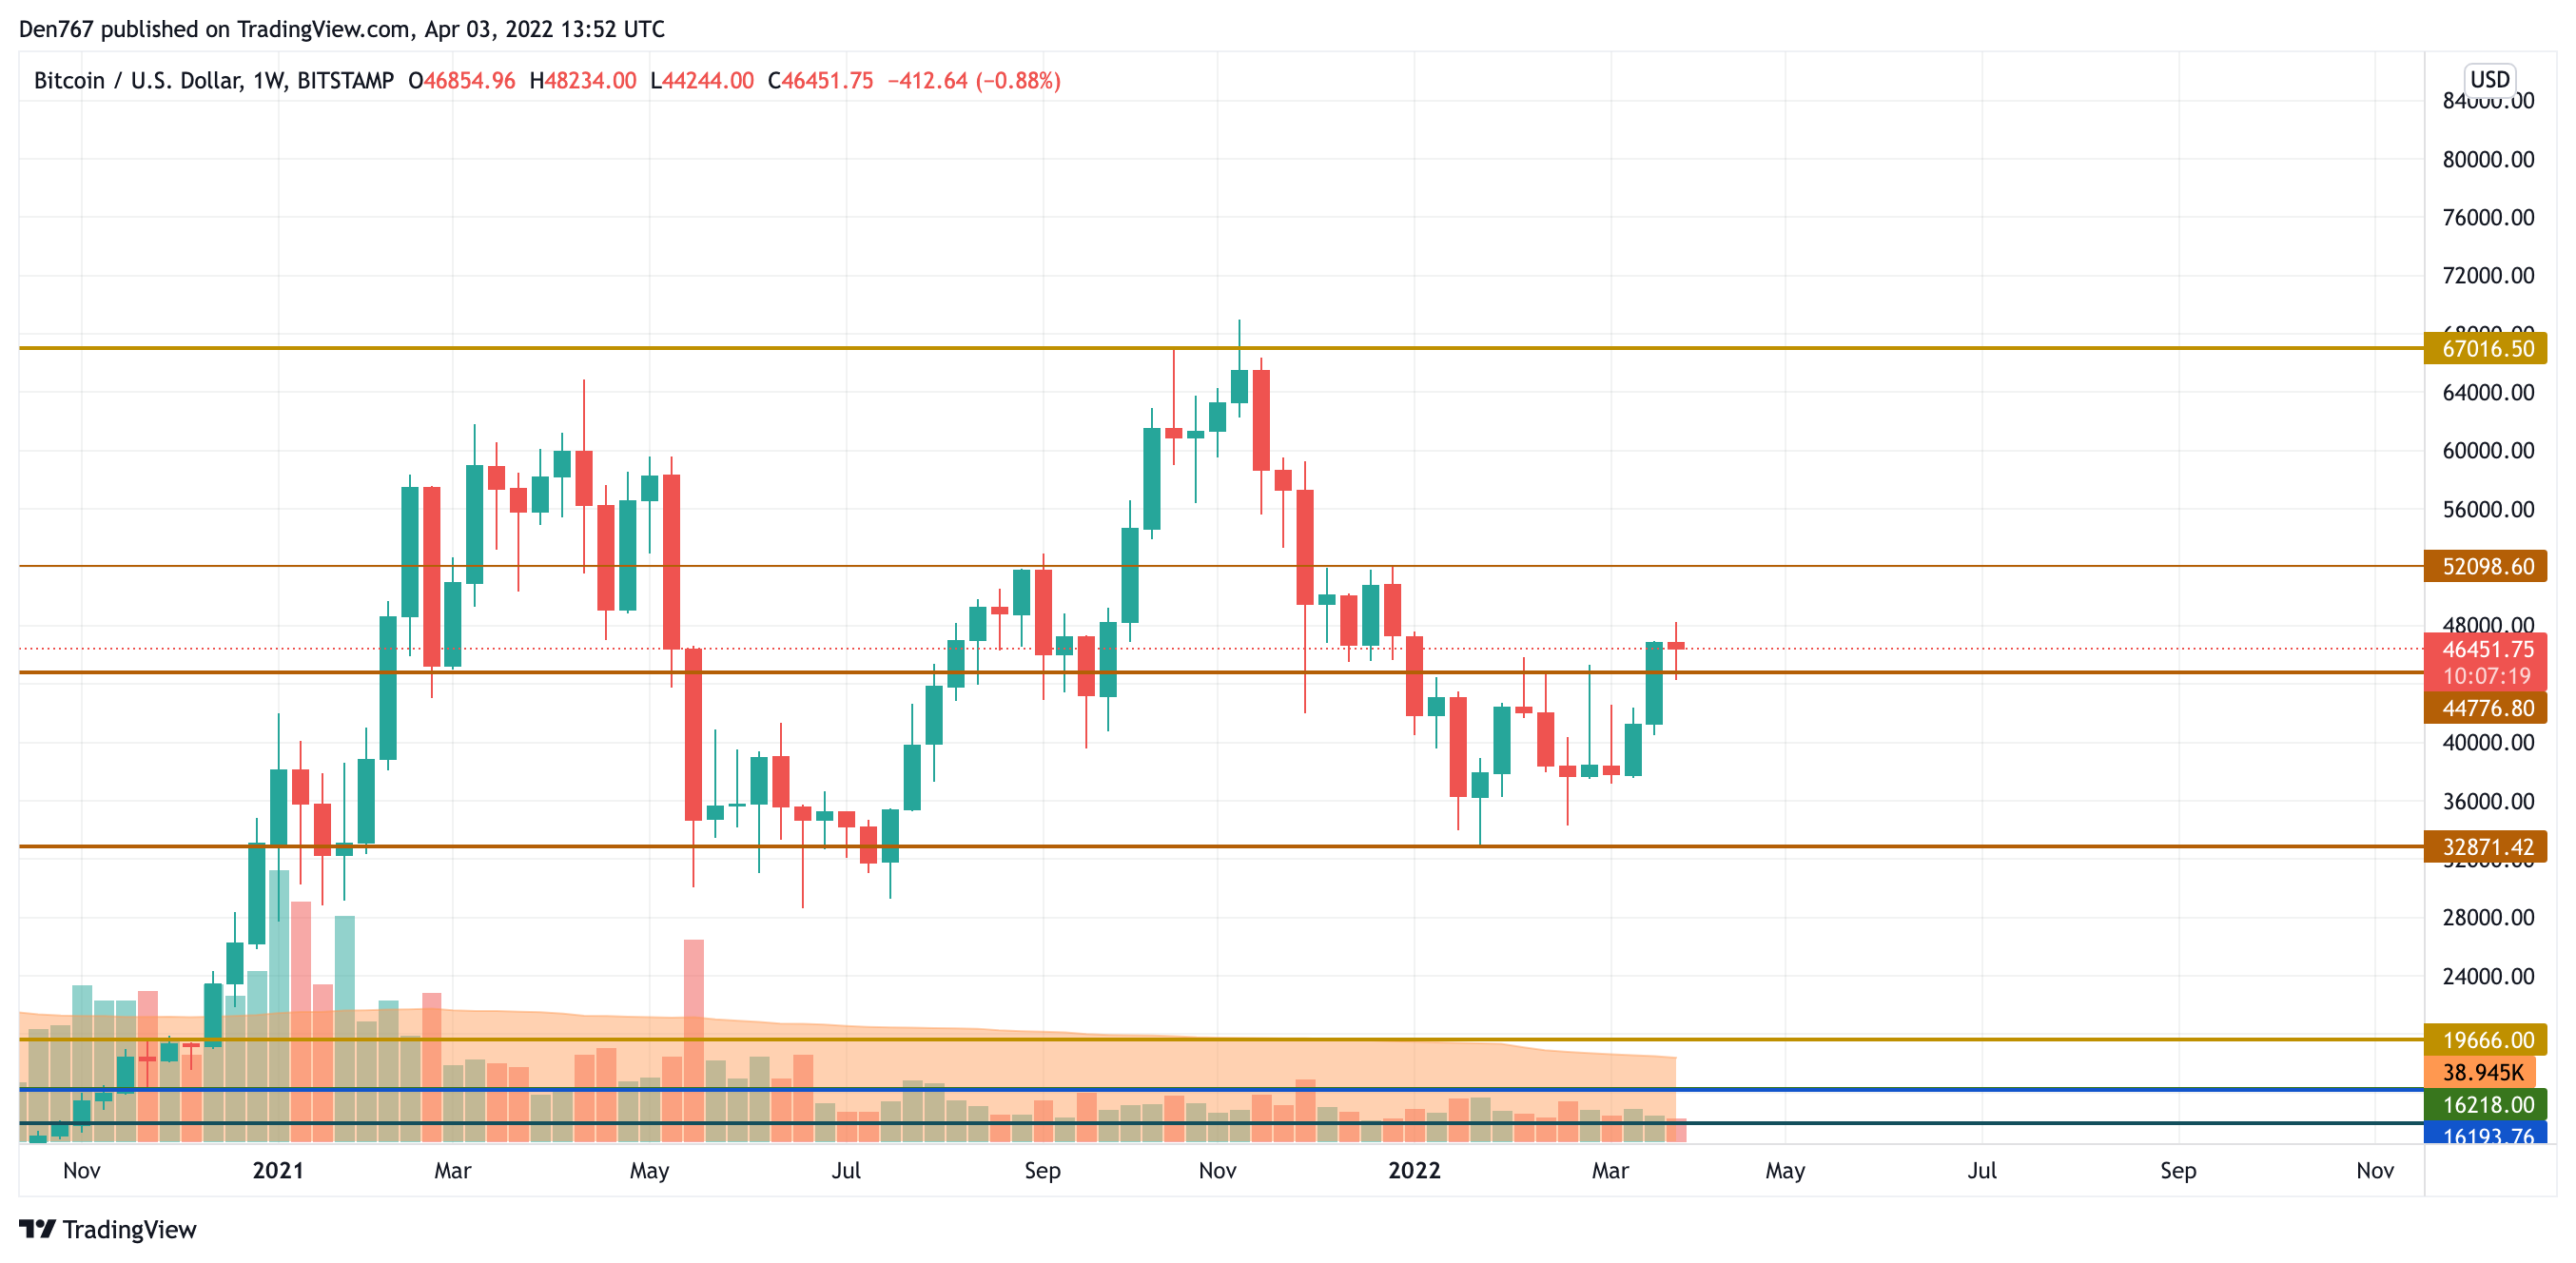
From the mid-term scenario, BTC remains bullish as bulls have fixed above the $45,000 mark. Now, the growth may slowly continue to $50,000 as the power has accumulated enough for further growth. However, a few weeks may pass until buyers come back to the nearest resistance at $52,000.
Bitcoin is trading at $46,451 at press time.