Be[in]Crypto takes a look at on-chain indicators for Bitcoin (BTC), more specifically the entity-adjusted dormancy flow and adjusted Spent Output Profit Ratio (aSOPR).
Entity-adjusted dormancy flow
Dormancy is a lifespan indicator. It measures the average number of coin days destroyed on each transaction. High values suggest that there are a lot of coin days destroyed in each transaction, while low volumes mean the opposite.
To simplify, high values suggest that coins that previously had not moved for a long period of time are on the move and vice versa.
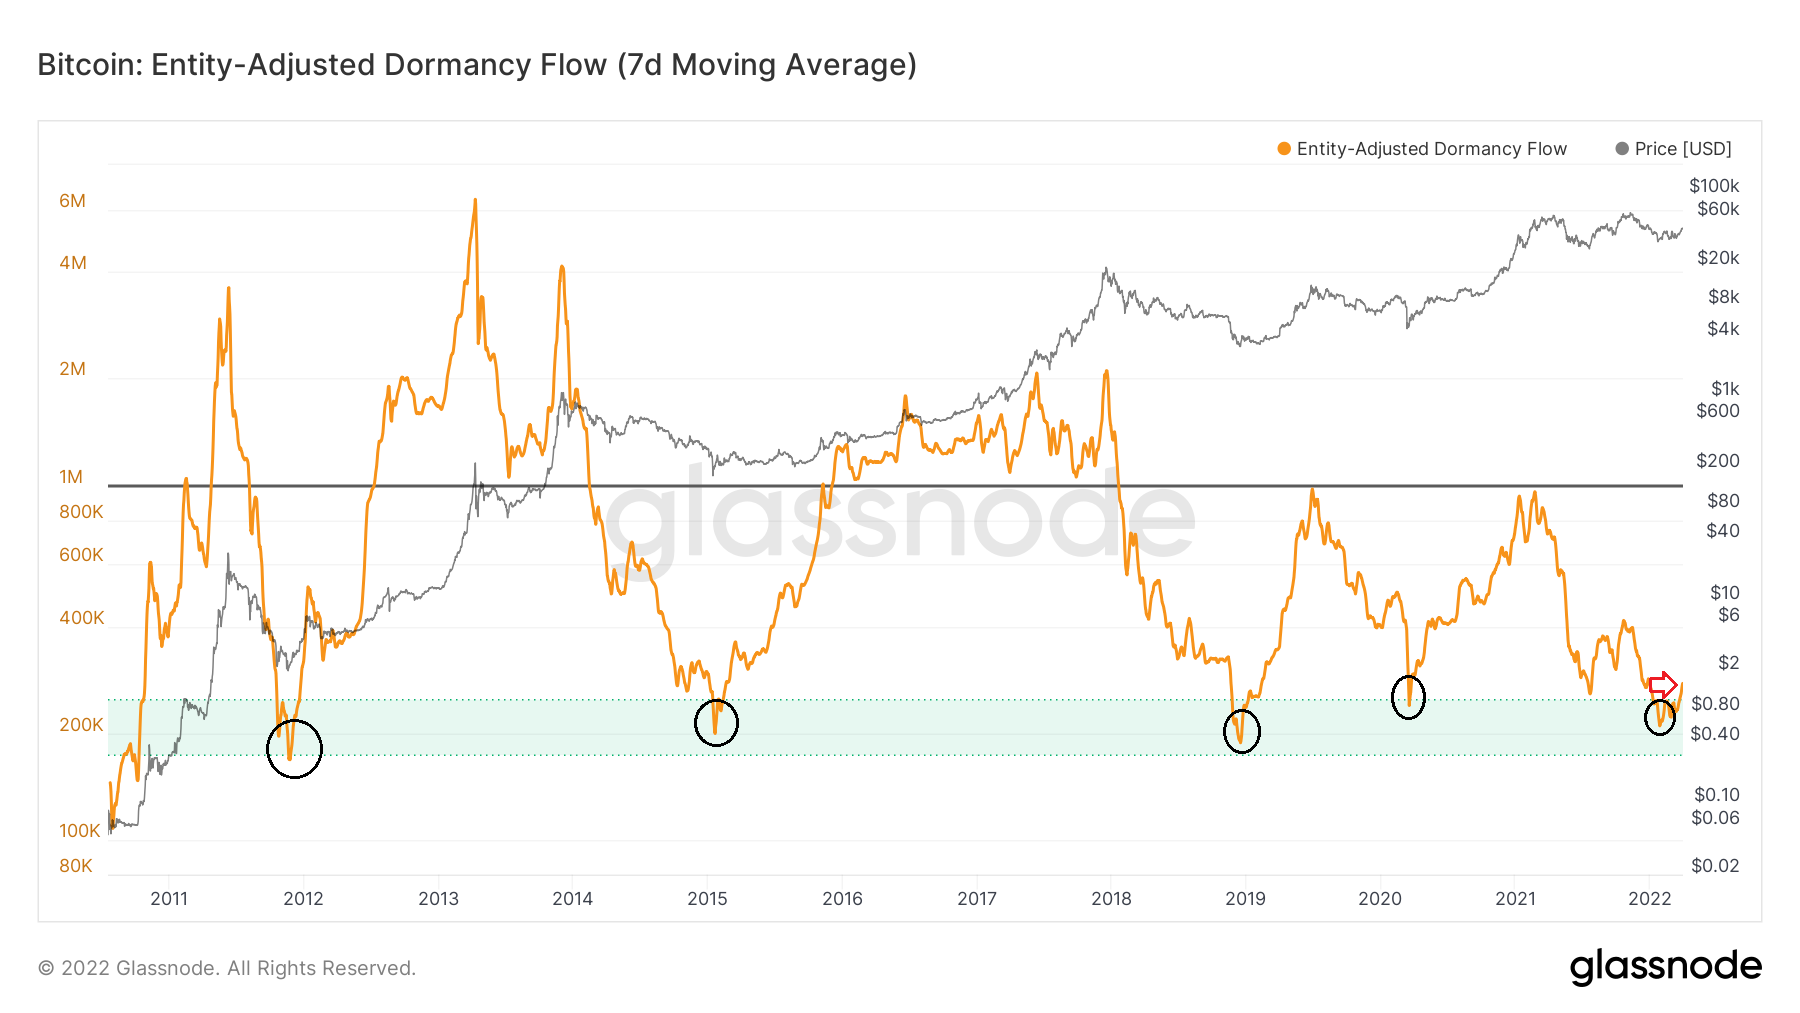
Entity-adjusted dormancy flow is a variation on this indicator that uses the ratio between the market capitalization and the aforementioned values. The indicator is used in order to predict market bottoms. In addition to this, it is used to determine if the long-term trend is bullish or bearish.
Historically, values below 250,000 have been associated with bottoms (black circles).
On Jan 27, the indicator reached a low of 210,000 and consolidated below 250,000 on March 22. Afterward, in a very important development, the indicator increased above 250,000 the next day (red arrow).
Historically, breakouts above 250,000 after a previous dip have coincided with the beginning of significant bull runs.
Spent Output Profit Ratio
SOPR is an on-chain indicator, which is calculated by dividing the price sold by the price paid for each coin. It is used to determine if the market is in an aggregate state of profit or loss.
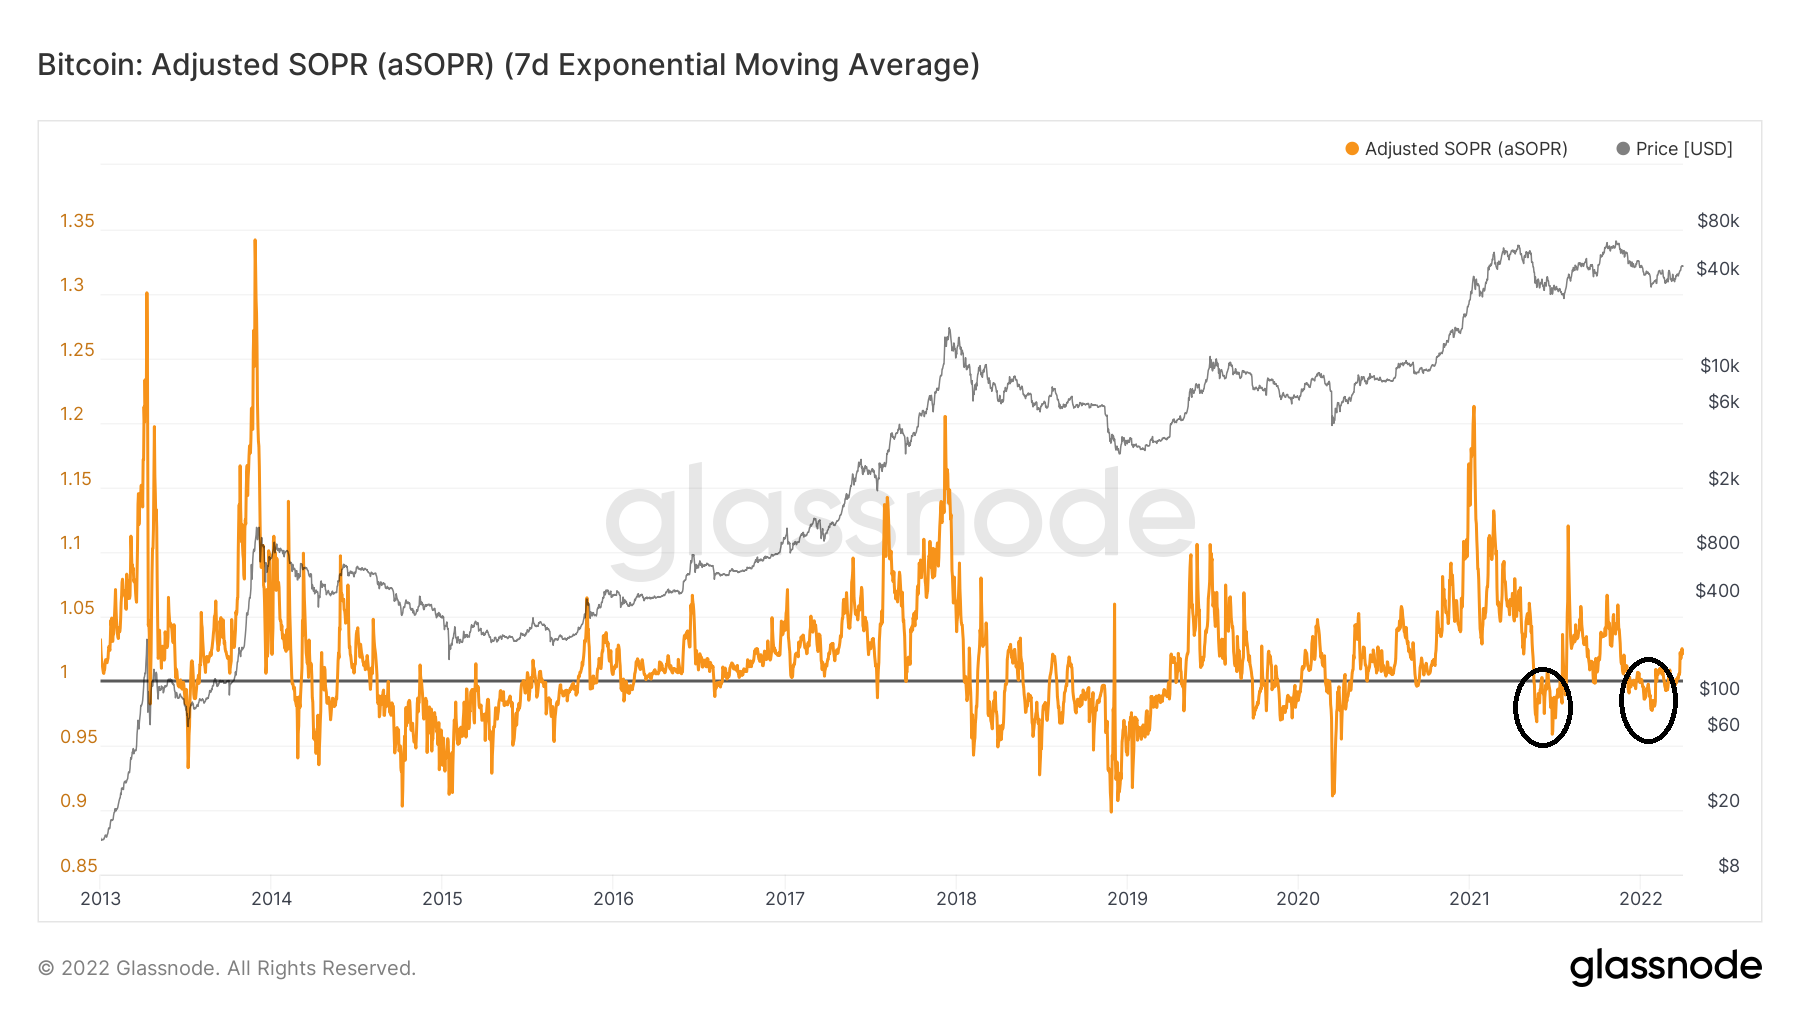
The adjusted SOPR (aSOPR) is a slight variation on it, which discards transactions with lifespans lower than one hour.
Historically, once a bull run begins, the indicator stays above one. This means that the market is in an aggregate state of profit since the price sold is higher than the price paid.
During corrective periods in bull markets, aSOPR bounces at the one line and resumes its uptrend.
In July 2021 and Jan 2022, aSOPR fell twice below the one line, which put the bullish trend in doubt.
However, it has reclaimed the line once more with a breakout on March 28. This can be seen as a bullish signal. A similar signal was given last month by the short-term SOPR.
Therefore, as long as it does not fall below one once more, the trend can be considered bullish.
Conclusion
Both the entity-adjusted dormancy flow and aSOPR have given bullish signals by breaking out from accumulation levels. This indicates that the long-term bullish trend is still intact.
For Be[in]Crypto’s latest Bitcoin (BTC) analysis, click here