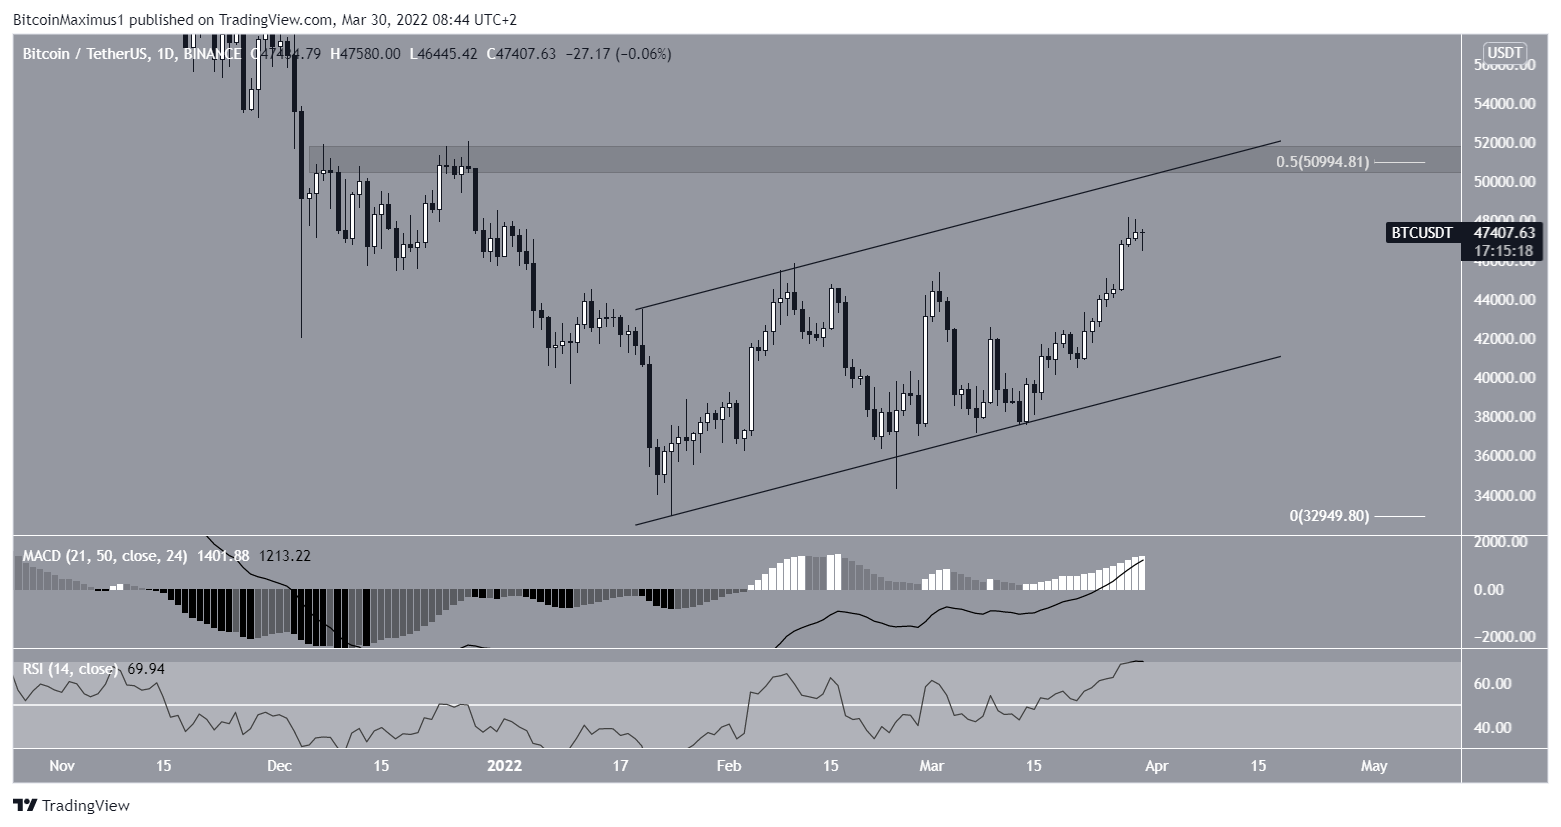
Bitcoin (BTC) has broken out from two short-term resistance levels and is gradually moving towards $51,000.
BTC has been increasing inside an ascending parallel channel since Jan 24. More recently, it bounced at its support line on March 14, and the price rose.
So far, BTC reached a high of $48,189 on March 28.
Technical indicators are bullish and support the continuation of the upward movement. This is visible in the increasing MACD and RSI. Also, the former is positive and the latter is above 70, both signs of a bullish trend.
If the upward movement continues, there is a confluence of resistance levels near $51,000. The resistance is created by :
- A horizontal resistance level
- The 0.5 Fib retracement resistance level
- The resistance line of an ascending parallel channel
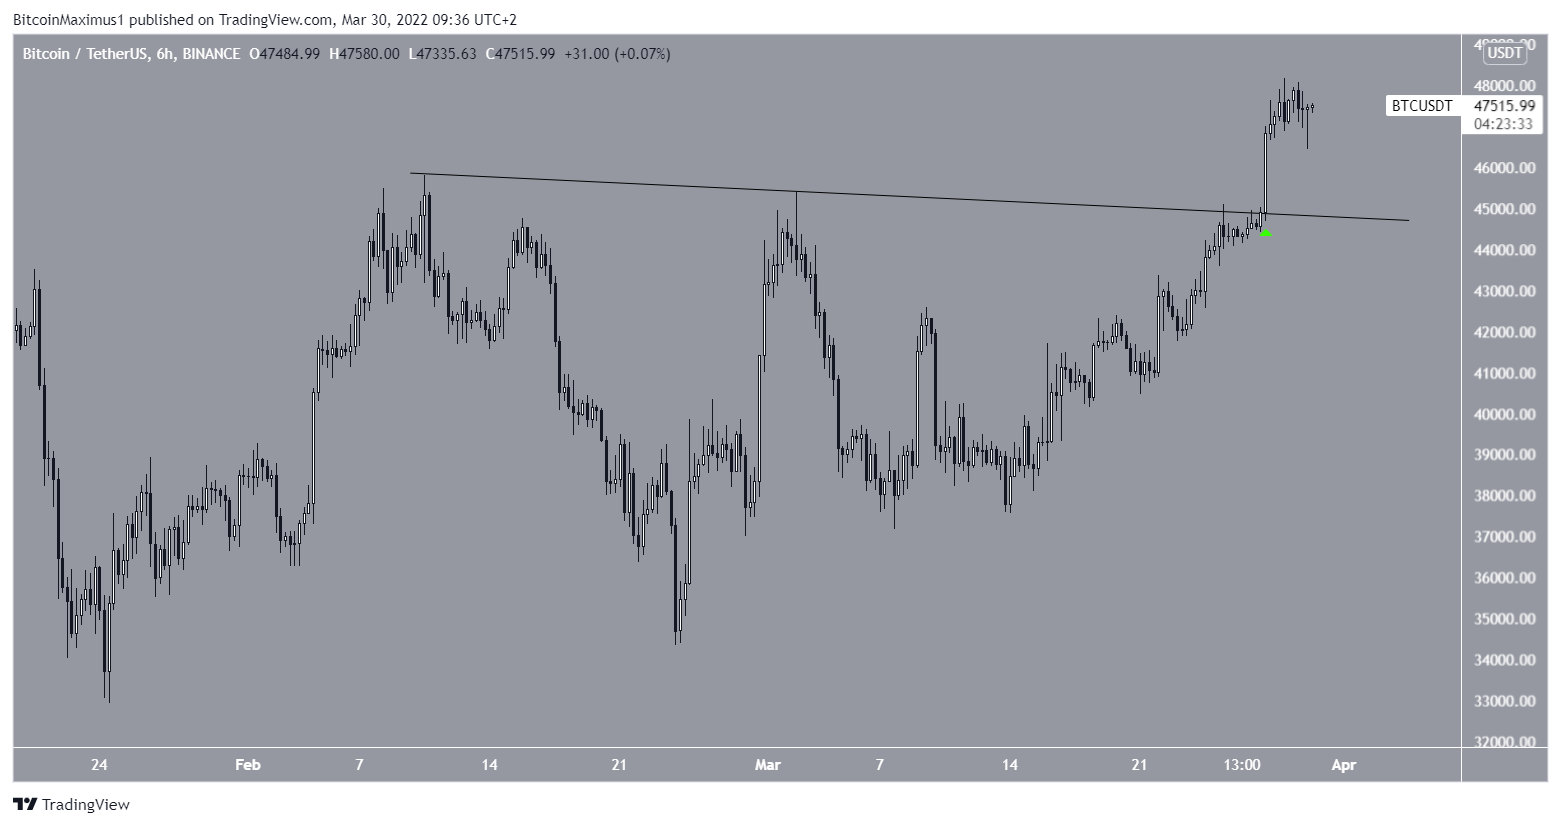
Short-term BTC movement
The six-hour chart shows that BTC has broken out (green icon) from a descending resistance line that has been in place since Feb 8.
This suggest that the previous correction has ended and an upward movement has begun.
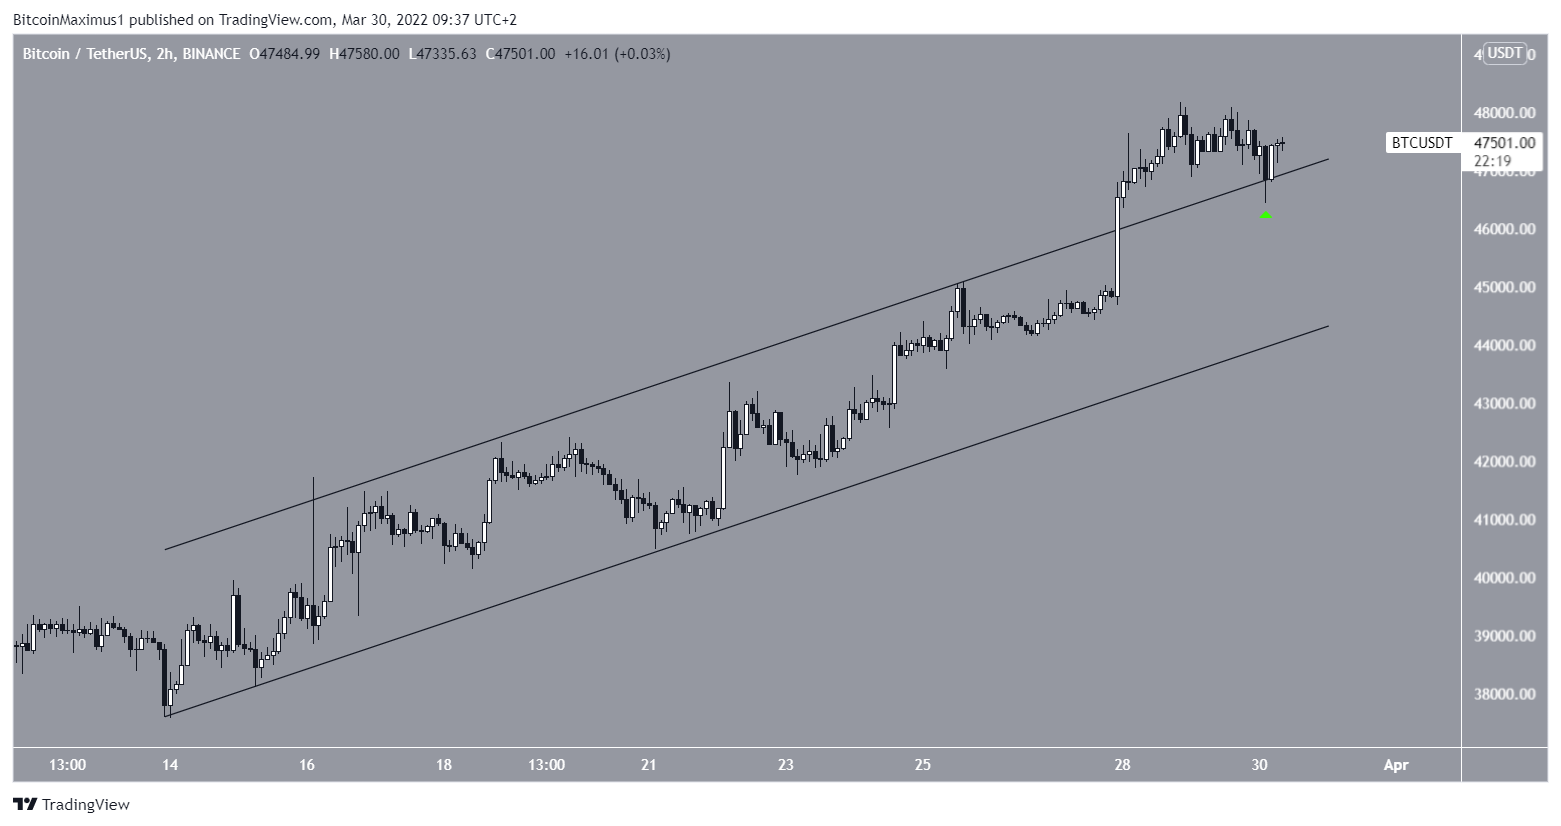
Furthermore, the two-hour chart shows that BTC has broken out from an ascending parallel channel and validated it as support afterward.
Therefore, it indicates that the short-term trend is bullish.
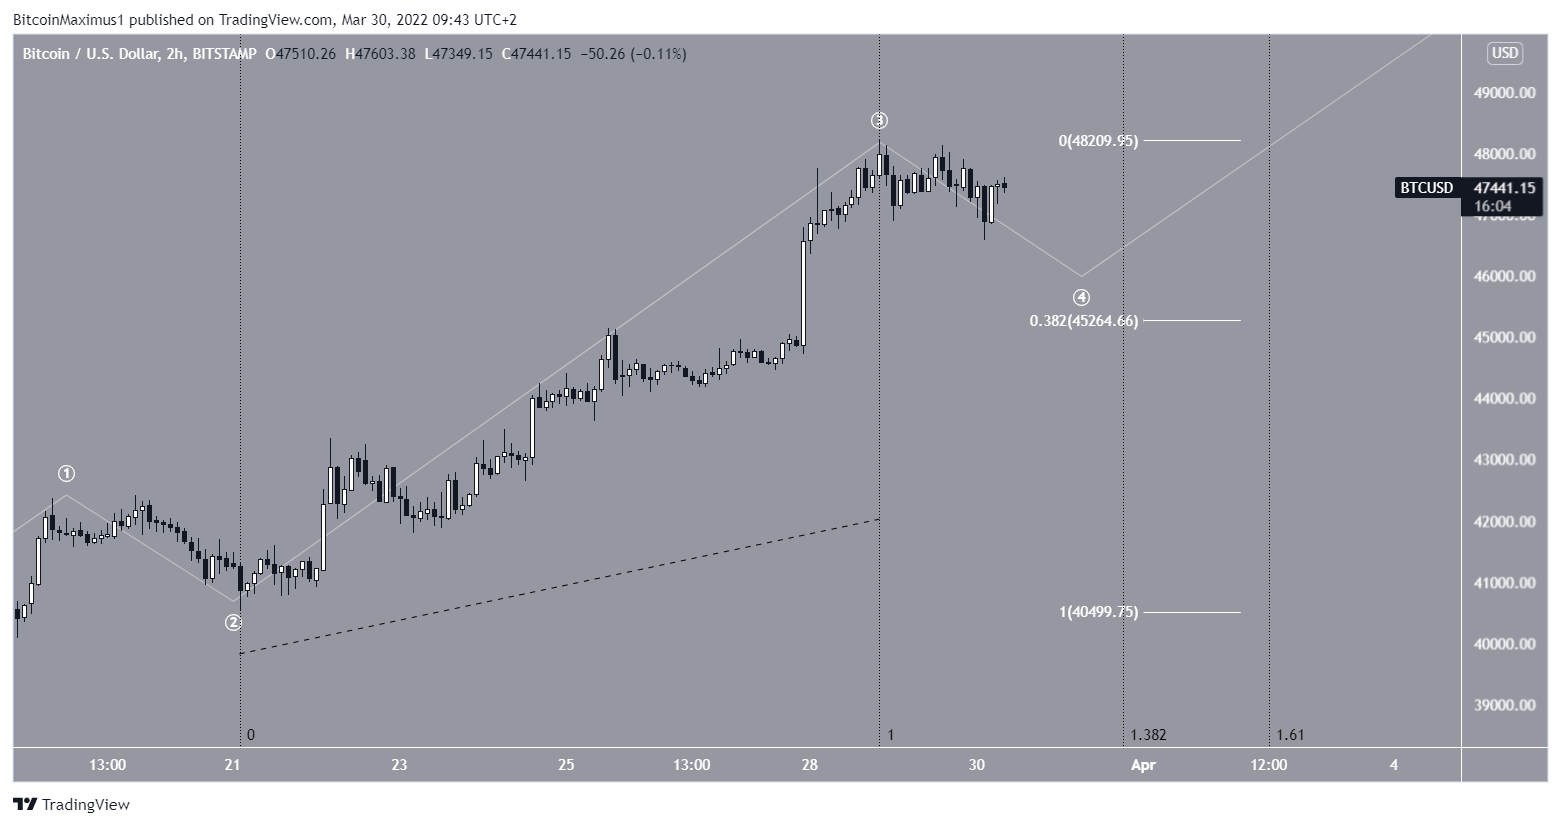
Wave count analysis
The most likely wave count suggests that BTC is in wave C of an A-B-C structure. The movement was validated once BTC broke out from a symmetrical triangle on March 23.
A high of $50,700 would give waves A:C a 1:1 ratio. It would also be very close to the previously outlined $51,000 resistance area.
The sub-wave count is given in white, suggesting that the price is either in sub-wave four or has just begun sub-wave five.

A closer look at the movement shows that it is likely that BTC is still in sub-wave four. The reason for this is that the ongoing retracement has been shallow in both price (white) and time (black), failing to reach the 0.382 Fib level.
While it is possible that sub-wave five has begun, the more textbook scenario suggests that the price is still correcting inside sub-wave four.
For BeInCrypto’s previous Bitcoin (BTC) analysis, click here