Seasoned trader Peter Brandt is keeping a close eye on Bitcoin (BTC) as the leading crypto by market cap threatens to print fresh 2022 highs.
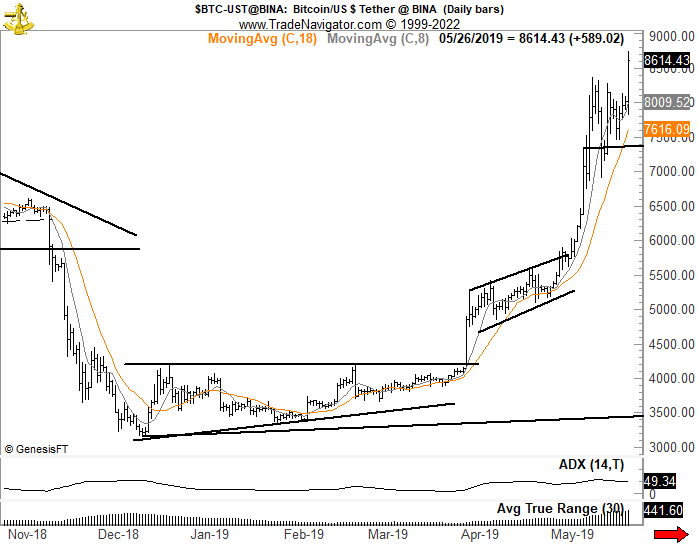
The veteran trader, who is known for correctly calling Bitcoin’s 2018 collapse, tells his 629,400 Twitter followers that Bitcoin’s recent price action is reminiscent of its market structure in April 2019 when BTC bottomed out at $3,500 before igniting the first leg of its bull cycle.
“The BTC pattern is called an ascending triangle [bottom]. Read about Asc Tris in Schabacker, Study III, pgs 93. Also, compare the present pattern to a similar structure in 2019 [top image]. Bitcoin.”
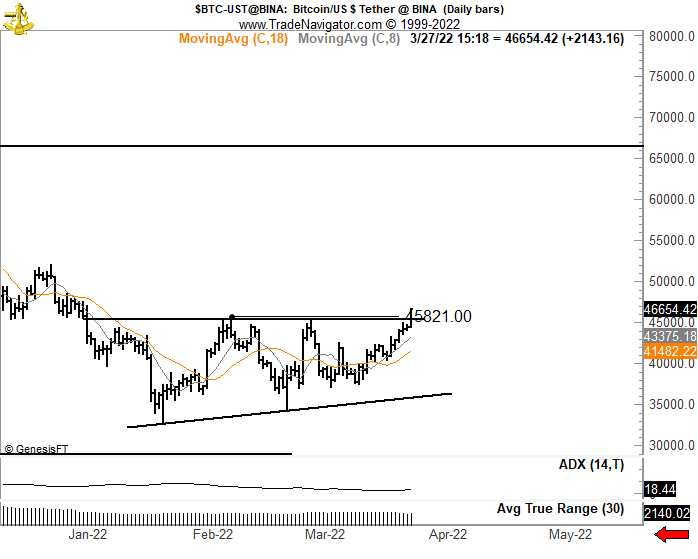
Looking at Brandt’s charts, the breakout from the ascending triangle pattern suggests that Bitcoin has carved out a bottom and is poised to start the next leg of its bull market.
However, Brandt emphasizes that even a technical breakout does not guarantee that Bitcoin will follow its 2019 rally.
“Charts do NOT predict the future. Charts do NOT even offer probabilities. Charts suggest possibilities and are useful in managing the risks in a trading program. Chart patterns can work, fail or morph. If laser eyes reappear and BTC stalls, then look out.”
Pseudonymous crypto analyst Dave the Wave posted a reply on Brandt’s thread showing Bitcoin is forming a larger ascending triangle on the weekly timeframe, suggesting that BTC could rally all the way up to its all-time high of $69,000.
According to Brandt, Bitcoin’s price action could follow Dave the Wave’s chart.
“I think the way you have your chart highlighted could be a real possibility.”