Whether it is Bitcoin or another asset, bottoms can be hard to spot until much later in hindsight. That is unless you are Peter Brandt, career commodities trader with nearly 50 years of market experience.
In a new comparison, Brandt compares the crypto bear market bottom he predicted a year in advance, with the current pattern that recently pushed Bitcoin beyond $45,000. Here is the full comparison along with why it might be worth listening to Brandt’s words of wisdom.
50-Year Trading Veteran Hints At Possible Bitcoin Bottom
In a new tweet, founder of The Factor Report Peter Brandt compares the late 2018, early 2019 bear market bottom, with the current Bitcoin price action.
Brandt specifically calls attention to the ascending triangle pattern that Bitcoin price appears to have broken out of, and its resemblance to what turned out to be the ultimate price floor.
Related Reading | This Bitcoin “Heatmap” Suggests A Blazing Cycle Peak Is Still Ahead
The classical chartist cites reference to what is considered “the real bible of technical analysis” – the book Technical Analysis and Stock Market Profits: A Course in Forecasting by Richard W. Schabacker. The expert technician even references the exact page number where more details on the pattern can be found.
In a recreation of Brandt’s chart below, the two potential Bitcoin bottoms are compared directly. In addition to the ascending triangle, there is also an Adam and Eve-like double bottom formation, and each bottom occurred along a similar trend line dating back almost a decade.
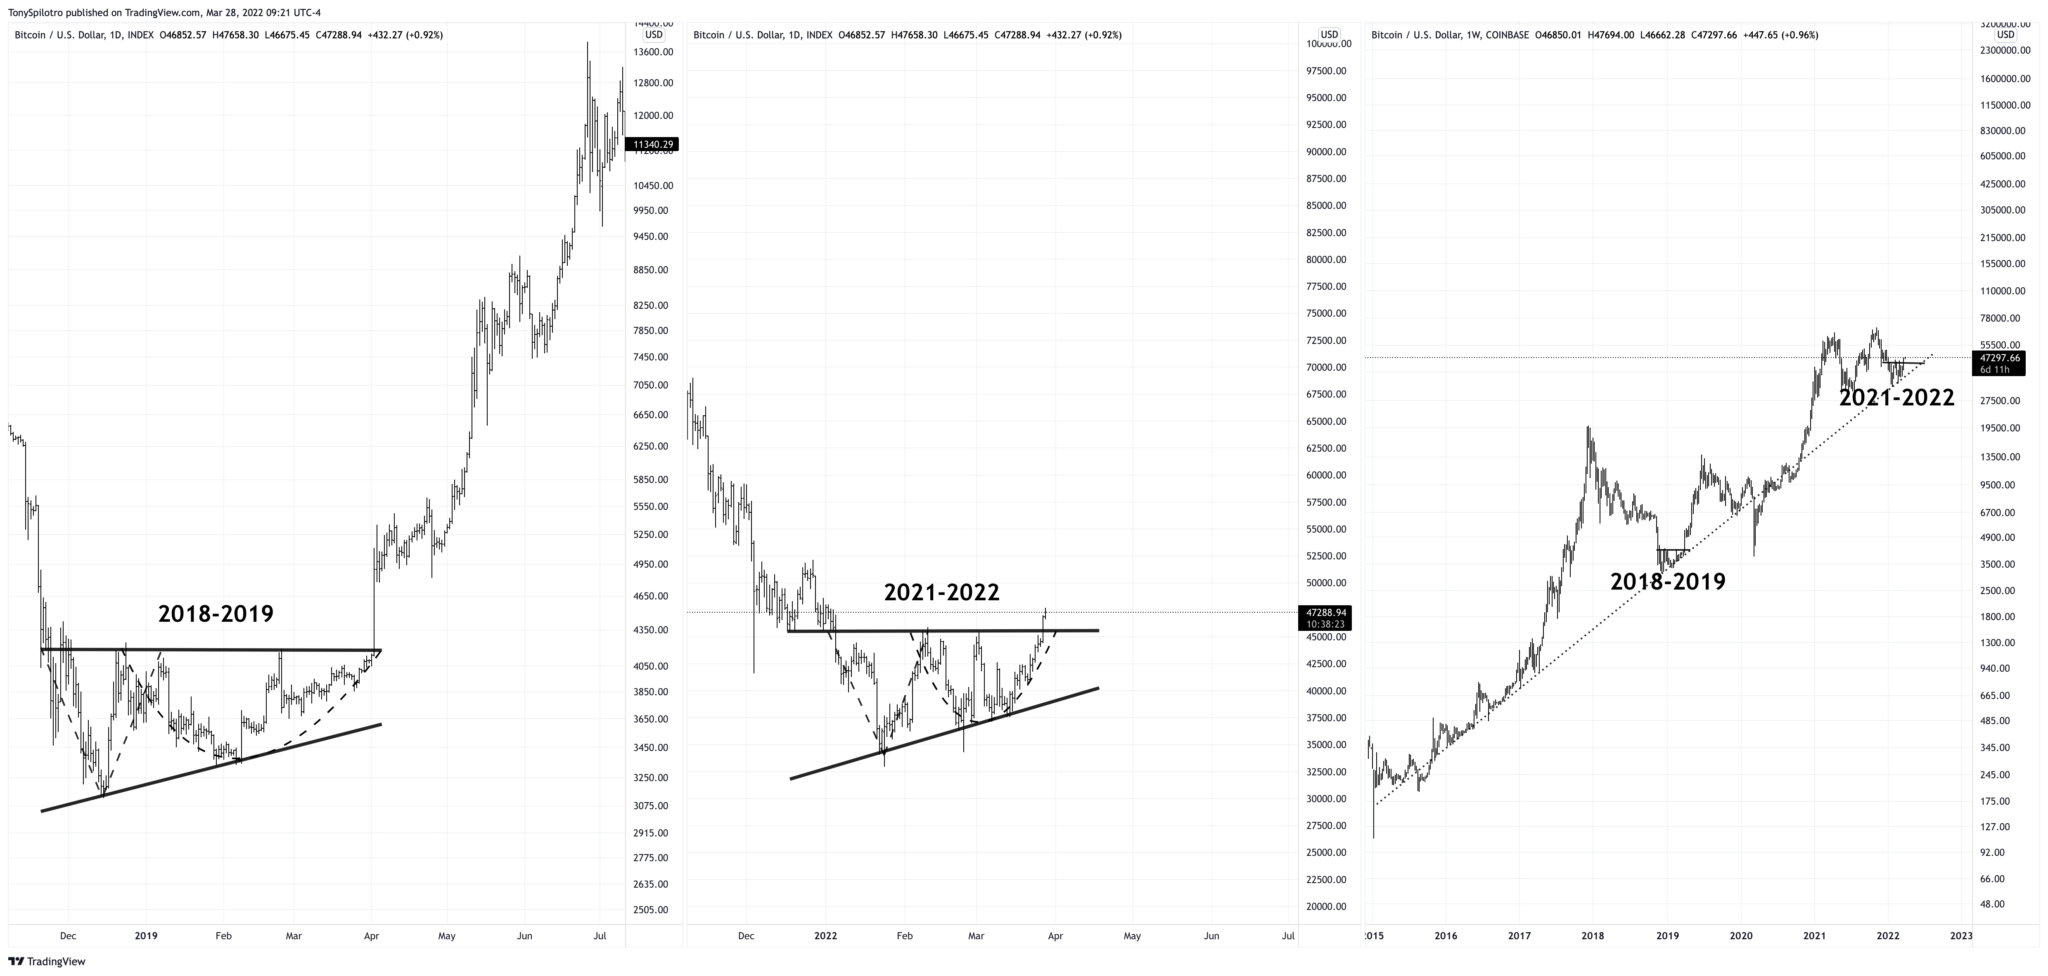
A recreation of Brandt's comparison with another look for good measure | Source: BTCUSD on TradingView.com
Why Peter Brandt’s Crypto Comparison Holds Weight
Because of Brandt’s sometimes bold calls that go against the hive mind of crypto Twitter, the trader often gets labeled a “hater.” In reality, he regularly says Bitcoin is among the most remarkable markets he’s ever traded and was among the first to call attention to the parabola building in 2016 and 2017.
When that parabolic advance was violated in late December 2017 and early 2018, he was also the first to suggest the way down was a lot further than most were ready to accept. Brandt called for a full 80% or more retrace in the price per coin of the top cryptocurrency almost a full year before it landed at his target.
Related Reading | Peter Brandt Calls For 80%+ Bitcoin Price Decline With Chilling Accuracy
Unlike what is commonly seen throughout the crypto world, Brandt doesn’t rely on complex technical indicators, buy or sell signals, or on-chain metrics. All he uses are straight or curved lines, which often accurately represent a contained trend. When such lines are violated, a trend change often follows.
With Bitcoin breaking above the top of an ascending triangle trend line, is Brandt specifically calling attention to a trend change ahead? If so, paying closer attention to the comparison between each major crypto bottom could be critical.ce.
Featured image from iStockPhoto, Charts from TradingView.com