Bitcoin Price Prediction: BTC Rallies 52% Against Gold Even as Geopolitical Risk Mounts
coinedition.com
21 September 2026 12:11, UTC
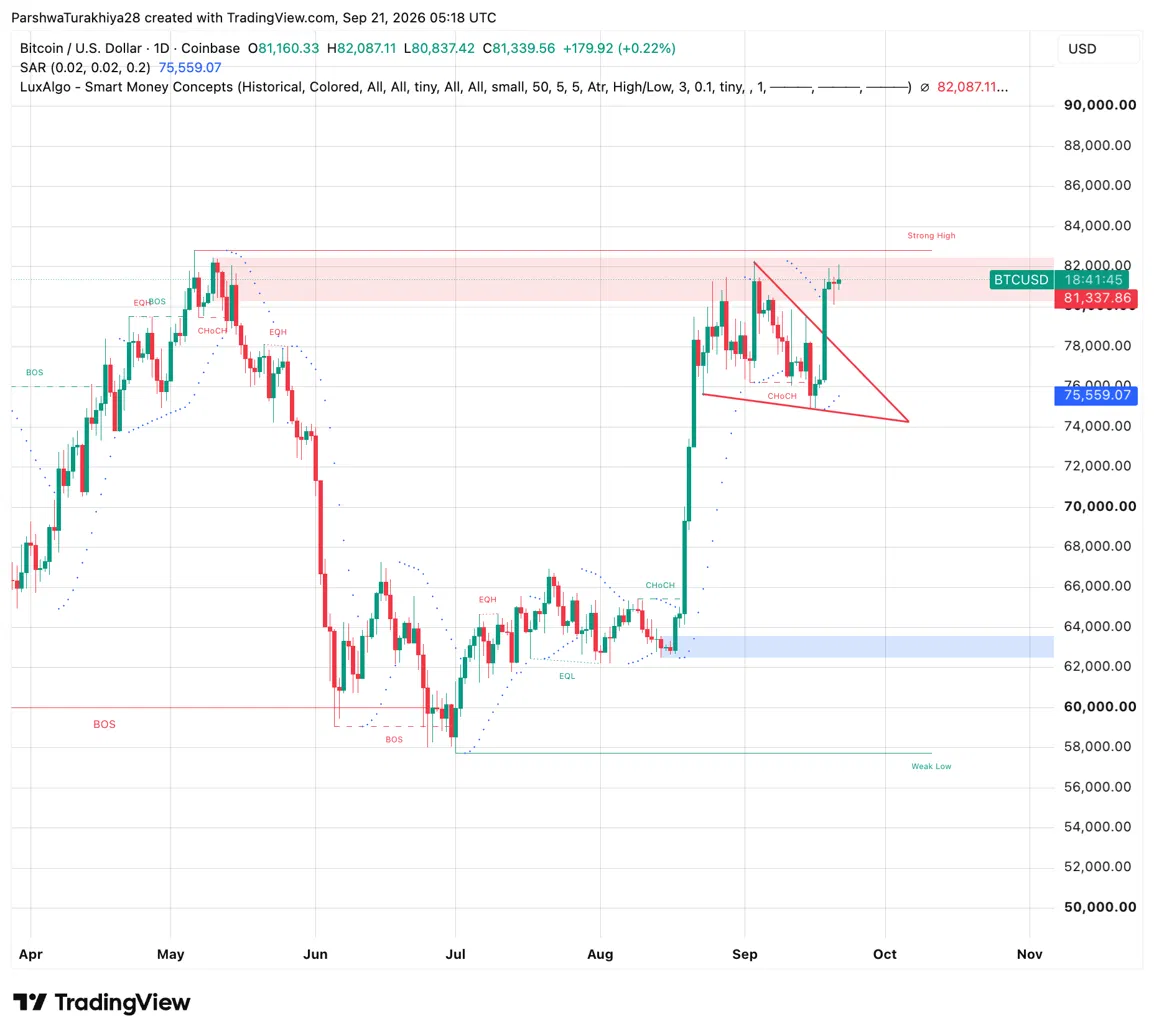
Bitcoin price prediction for September 22 stays bullish above $80,837, the level $BTC is defending inside a descending triangle even after closing the week above its 50-week moving average for the first time since November 2025.
Bitcoin Price Analysis: Can $BTC Break Its Descending Triangle?
Bitcoin Price Analysis (Source: TradingView)
$BTC trades near $81,338, up 0.22% today, consolidating inside a descending triangle that’s formed since the early September high near $82,900:
Know when your coins move
Alerts, real-time prices, and market news — all in one app
Point your phone camera to install
4.8 based on 40K reviews in the App Store and Google Play
Flat support: $75,559, close to the Parabolic SAR reading
Descending resistance: connects lower highs down from the September peak toward a current apex near $81,500
Strong high zone: $81,500 to $82,900, tested but not yet closed above on a daily basis
Smart money structure shows a change of character forming near $76,700, followed by a break of structure that carried price back toward this week’s high. A confirmed break above $82,087, today’s session high, would put the strong high zone in range for the first time since early September.
$BTC Support and Resistance Levels
Type
Price
Resistance
$82,087
Resistance
$82,900
Resistance
$84,000
Support
$80,837
Support
$75,559
Support
$57,900
Bitcoin News: $BTC Reclaims Its 50-Week Moving Average for the First Time in 45 Weeks
BREAKING: Bitcoin printed its highest weekly close in 4 months and reclaimed the 50-week MA for the first time since Nov 2025. pic.twitter.com/K4wkX902nB
— Bull Theory (@BullTheoryio) September 21, 2026
Bitcoin closed the week ended September 20 above its 50-week moving average for the first time in 45 weeks, a signal Galaxy Research’s Alex Thorn called a potentially important confirmation that the bear phase has run its course, according to CoinDesk. $BTC rose nearly 6% over the week and has rebounded 29% over the past 35 days, with the weekly candle closing clearly above the average rather than just touching it intraweek, a distinction analysts weigh more heavily.
Related: Cardano Price Prediction Q4 2026: Can ADA Clear the $0.24 Wall?
Galaxy looked at major Bitcoin drawdowns since 2011 and found 13 instances of $BTC closing a week back above the 50-week average, with 11 of those not going on to set a new low. Four stand out for the rallies that followed:
January 2012: $BTC rallied roughly 600-fold from around $2 to near $1,200 by late 2013
October 2015: $BTC rallied roughly 100-fold to a record near $20,000 by December 2017
May 2019: $BTC rallied roughly 22-fold from near $3,200 to a record above $69,000 by November 2021
March 2023: $BTC rallied roughly eightfold from near $15,500 to a record near $126,000 by October 2025
Two crossovers failed to hold, both during the volatile stretch from late 2021 to early 2022, when $BTC briefly moved above the average before rolling over toward $16,000. $BTC currently trades near $81,450 with the 50-week average at $78,115, a real cushion but not a large one.
Bitcoin is back above $81,000 and $ETH has reclaimed $2,600 while "WW3" is trending worldwide.
Russia-Ukraine just saw a massive escalation with a drone attack today.
CNN reports Trump is planning major military ops against Houthis in Yemen.
The US-Iran… https://t.co/s5wO9TZsYf pic.twitter.com/knlLFHt4dK
— Ash Crypto (@AshCrypto) September 20, 2026
Bitcoin’s rally is happening alongside, rather than because of, calmer geopolitical conditions. Trader Ash Crypto pointed out $BTC trading above $81,000 and $ETH reclaiming $2,600 even as “WW3” trended worldwide following a major escalation in the Russia-Ukraine conflict, a reported drone attack, alongside CNN coverage of planned US military operations against Houthi forces in Yemen and an ongoing US-Iran conflict.
Ash Crypto framed the divergence as evidence Bitcoin is cementing itself as a safe-haven asset, noting $BTC is up 51.9% against gold since the US-Iran conflict began. That’s one trader’s interpretation of the price action rather than a confirmed shift in how institutional allocators treat Bitcoin, though it lines up with the ETF inflow data below showing steady buying through a volatile macro backdrop.
Bitcoin ETF Flows: A Third Straight Inflow Day Pushes Cumulative Total Past $55 Billion
US spot Bitcoin ETFs added $433.03 million on September 18, a third straight inflow day following $159.45 million on September 17 and a $295.98 million outflow on September 16. Cumulative net inflows now stand at $55.16 billion, with $4.67 billion traded on the day and total net assets at $102.53 billion.
The weekly trend backs up the recovery. The week of September 18 is tracking a modest $6.21 million net gain after a $462.73 million outflow the prior week, itself a pullback from three straight positive weeks that added more than $3.8 billion between mid-August and early September.
Fidelity’s FBTC led Friday’s inflow at $310.72 million, followed by BlackRock’s IBIT at $108.44 million. IBIT remains the largest fund by net assets at $63.82 billion, while Grayscale’s legacy GBTC, which has bled a cumulative $27.84 billion since converting from a trust, holds $10.33 billion in net assets.
Bitcoin Derivatives: Shorts Take the Bulk of a Quiet Liquidation Day
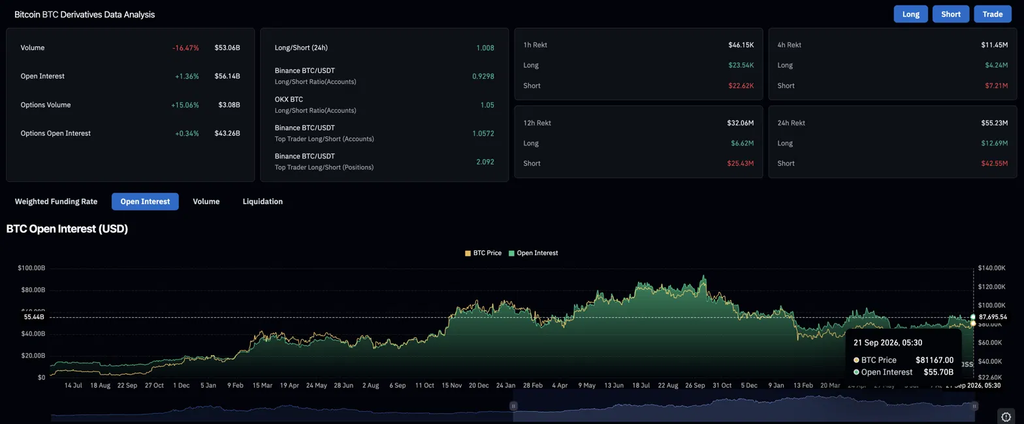
Bitcoin Derivative Analysis (Source: Coinglass)
$BTC derivatives volume fell 16.47% to $53.06 billion over the past 24 hours, while open interest rose 1.36% to $56.14 billion, traders holding positions even as trading slowed down.
Shorts took the bigger hit today. They lost $42.55 million against just $12.69 million for longs, and that same gap showed up over the past 12 hours too. Binance’s overall positioning sits close to even, but its larger accounts lean long at a 2.092 ratio.
Metric
Value
What it shows
Derivatives volume (24h)
$53.06B, down 16.47%
Trading activity cooled
Open interest
$56.14B, up 1.36%
Positions building despite less trading
24h short liquidations
$42.55M of $55.23M total
Shorts took the bigger share of today’s losses
Binance top trader ratio
2.092
Larger accounts leaning long
Bitcoin Price Prediction: Bullish and Bearish Scenarios for September 22
Bullish Case, Target: $84,000
$BTC breaks above the descending triangle’s resistance and clears $82,087, the session high marking the base of the range’s strong high zone. Continued ETF inflows and the 50-week average reclaim holding through the coming weeks could support a push toward $84,000 and beyond.
Bearish Case, Risk Level: $75,559 (Parabolic SAR)
$BTC loses the triangle’s flat support near $80,837 and slips toward the Parabolic SAR at $75,559. A failed 50-week average reclaim, similar to the two failed attempts in late 2021 and early 2022, or a reversal in ETF flows would fit that scenario, exposing the weak low near $57,900 as the range’s deeper support.
FAQs
What is the Bitcoin price prediction for September 22, 2026?
$BTC could extend toward $82,087 and then $84,000 if it clears the current descending triangle. Losing support near $80,837 risks a slide toward the Parabolic SAR at $75,559.
What does Bitcoin reclaiming its 50-week moving average mean?
$BTC closed a week above this long-term trend indicator for the first time in 45 weeks, a signal that has preceded major rallies in 11 of 13 similar instances since 2011, according to Galaxy Research, though two prior reclaims in 2021 and 2022 failed to hold.
Why is Bitcoin rallying despite rising geopolitical tension?
Traders have pointed to $BTC’s resilience amid conflicts involving Russia-Ukraine, Yemen, and Iran as evidence it’s behaving more like a safe-haven asset, with one trader noting $BTC is up 51.9% against gold since the US-Iran conflict began.
Are Bitcoin ETFs still seeing inflows?
Yes. US spot Bitcoin ETFs added $433.03 million on September 18, a third straight positive session, pushing cumulative net inflows to $55.16 billion.

 coinedition.com